

Question: 2. Answer with complete solutions with graphical representation as much as possible. Take note of the significant figures. . (a) Compute the average acceleration during
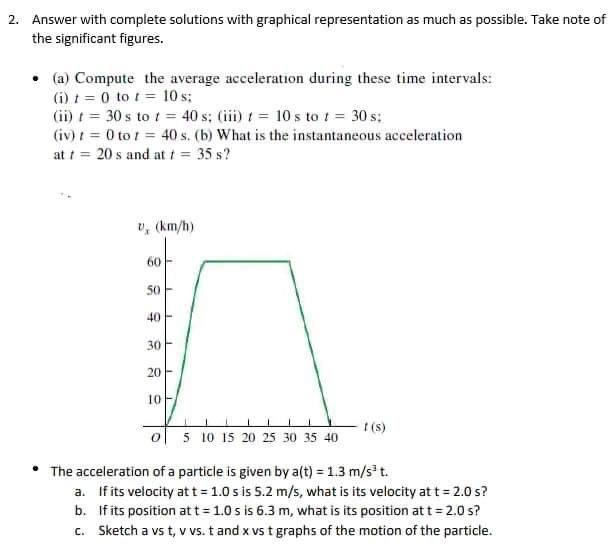

2. Answer with complete solutions with graphical representation as much as possible. Take note of the significant figures. . (a) Compute the average acceleration during these time intervals: (i) t = 0 to / = 10s: (ii) / = 30s to / = 40 s; (lib) / = 10 s to / = 30 s: (iv) / = 0 to / = 40s. (b) What is the instantaneous acceleration at / = 20 s and at / = 35 s? U, (km/h) 60 50 40 30 20- 10 1 (s) 5 10 15 20 25 30 35 40 " The acceleration of a particle is given by a(t) = 1.3 m/s' t. a. If its velocity at t = 1.0s is 5.2 m/s, what is its velocity at t = 2.0s? b. If its position at t = 1.0 s is 6.3 m, what is its position at t = 2.0 s? c. Sketch a vs t, v vs. t and x vs t graphs of the motion of the particle
Step by Step Solution
There are 3 Steps involved in it

Get step-by-step solutions from verified subject matter experts