

Question: 2. Based on the following data, a. Determine and interpret the first, second, and third quartiles. b. Determine and interpret the interquartile range. c. Construct
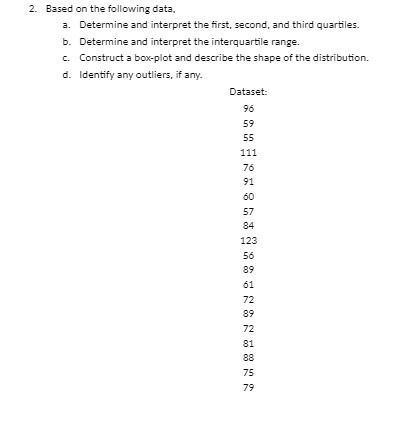
2. Based on the following data, a. Determine and interpret the first, second, and third quartiles. b. Determine and interpret the interquartile range. c. Construct a box-plot and describe the shape of the distribution. d. Identify any outliers, if any. Dataset: 96 59 55 111 76 91 60 57 84 123 56 89 61 72 89 72 81 88 75 79
Step by Step Solution
There are 3 Steps involved in it
1 Expert Approved Answer
Step: 1 Unlock

Question Has Been Solved by an Expert!
Get step-by-step solutions from verified subject matter experts
Step: 2 Unlock
Step: 3 Unlock