

Question: 2. Be sure to show the vertical analysis AND explain what the results of the vertical analysis mean to your company. (Example of a vertical
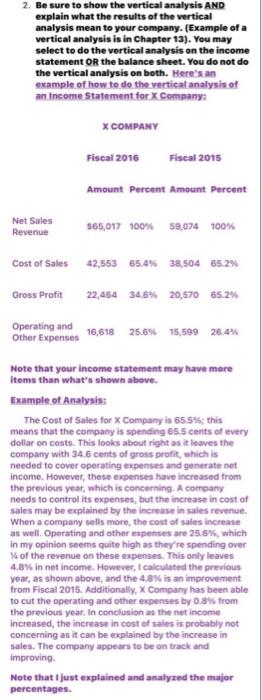
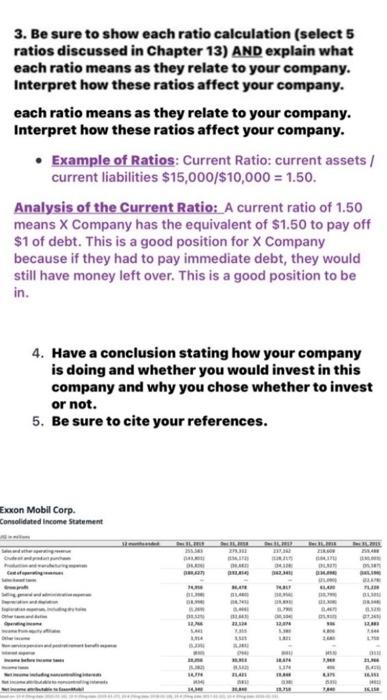
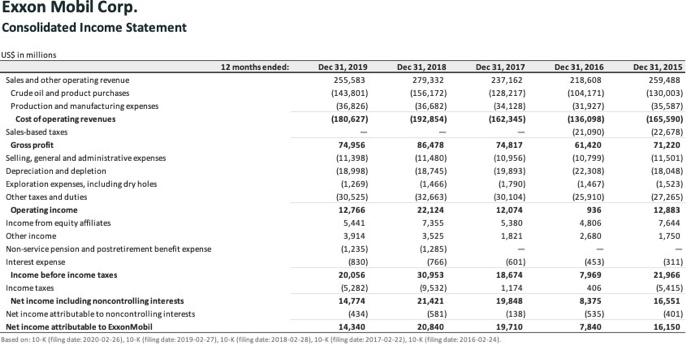
2. Be sure to show the vertical analysis AND explain what the results of the vertical analysis mean to your company. (Example of a vertical analysis is in Chapter 13). You may select to do the vertical analysis on the income statement OR the balance sheet. You do not do the vertical analysis on both. Here's an example of how to do the vertical analysis of an Income Statement for X Company X COMPANY Fiscal 2015 Fiscal 2015 Amount Percent Amount Percen Net Sales Revenue 565,017 100% 59,074 100% Cost of Sales 42,553 65.4% 38,504 65 29 Gross Profit 22,464 34.6% 20,570 65.2% Operating and Other Expenses 16,618 25.696 15,599 26.4% Note that your income statement may have more items than what's shown above. Example of Analysis: The Cost of Sales for X Company is 65.5% this means that the company is spending 65.5 cents of every dollar on costs. This looks about right as it leaves the company with 34.6 cents of gross profit, which is needed to cover operating expenses and generate net income. However, these expenses have increased from the previous year, which is concerning. A company needs to control its expenses, but the increase in cost of sales may be explained by the increase in sales revenue. When a company sells more, the cost of sales increase as well. Operating and other expenses are 25.5%, which in my opinion seems quite high as they're spending over of the revenue on these expenses. This only leaves 4.8% in net income. However, I calculated the previous year, as shown above, and the 4.8% is an improvement from Fiscal 2015. Additionally, X Company has been able to cut the operating and other expenses by 0.8% from the previous year. In conclusion as the net income increased, the increase in cost of sales is probably not concerning as it can be explained by the increase in sales. The company appears to be on track and improving Note that just explained and analyzed the major percentages. 3. Be sure to show each ratio calculation (select 5 ratios discussed in Chapter 13) AND explain what each ratio means as they relate to your company. Interpret how these ratios affect your company. each ratio means as they relate to your company. Interpret how these ratios affect your company. Example of Ratios: Current Ratio: current assets/ current liabilities $15,000/$10,000 = 1.50. Analysis of the Current Ratio: A current ratio of 1.50 means X Company has the equivalent of $1.50 to pay off $1 of debt. This is a good position for X Company because if they had to pay immediate debt, they would still have money left over. This is a good position to be in. 4. Have a conclusion stating how your company is doing and whether you would invest in this company and why you chose whether to invest or not. 5. Be sure to cite your references. Exxon Mobil Corp. Consolidated Income Statement D DUR NE BAN Exxon Mobil Corp. Consolidated Income Statement US$ in millions 12 months ended: Dec 31, 2019 Dec 31, 2018 Dec 31, 2017 Sales and other operating revenue 255,583 279,332 237,162 Crude oil and product purchases (143,801) (156,172) (128,217) Production and manufacturing expenses (36,826) (36,682) (34,128) Cost of operating revenues (180,627) (192,854) (162,345) Sales based taxes Gross profit 74,956 86,478 74,817 Selling general and administrative expenses (11,398) (11,480) (10,956) Depreciation and depletion (18,998) (18,745) (19,893) Exploration expenses, including dry holes (1,269) (1.466) (1.790) Other taxes and duties (30,525) (32,663) (30,104) Operating income 12,766 22,124 12,074 Income from equity affiliates 5,441 7,355 5,380 Other income 3,914 3,525 1,821 Non-service pension and postretirement benefit expense (1,235) (1,285) Interest expense (830) (601) Income before income taxes 20,056 30,953 18,674 Income taxes (5,282) 19,532) 1,174 Net income including noncontrolling interests 14,774 21,421 19,848 Net income attributable to noncontrolling interests (434) (581) (138) Net income attributable to boxonMobil 14,340 20,840 19,710 Based on10 King date: 2020-02-26). 10 King date: 2019-02-271,10 Kg date: 2018-02-28 10-ing date: 2017-02-22 10. Killing date: 2016-02-24) Dec 31, 2016 218,608 (104,171) (31,927) (136,098) (21,090) 61,420 (10,799) (22,308) (1,467) (25,910) 936 4,806 2,680 Dec 31, 2015 259,488 (130,003) (35,587) (165,590) (22,678) 71,220 (11,501) (18,048) (1,523) (27,265) 12,883 7.644 1,750 (766) (453) 7,969 406 8,375 (535) 7,840 (311) 21,966 15,415) 16,551 (401) 16,150 2. Be sure to show the vertical analysis AND explain what the results of the vertical analysis mean to your company. (Example of a vertical analysis is in Chapter 13). You may select to do the vertical analysis on the income statement OR the balance sheet. You do not do the vertical analysis on both. Here's an example of how to do the vertical analysis of an Income Statement for X Company X COMPANY Fiscal 2015 Fiscal 2015 Amount Percent Amount Percen Net Sales Revenue 565,017 100% 59,074 100% Cost of Sales 42,553 65.4% 38,504 65 29 Gross Profit 22,464 34.6% 20,570 65.2% Operating and Other Expenses 16,618 25.696 15,599 26.4% Note that your income statement may have more items than what's shown above. Example of Analysis: The Cost of Sales for X Company is 65.5% this means that the company is spending 65.5 cents of every dollar on costs. This looks about right as it leaves the company with 34.6 cents of gross profit, which is needed to cover operating expenses and generate net income. However, these expenses have increased from the previous year, which is concerning. A company needs to control its expenses, but the increase in cost of sales may be explained by the increase in sales revenue. When a company sells more, the cost of sales increase as well. Operating and other expenses are 25.5%, which in my opinion seems quite high as they're spending over of the revenue on these expenses. This only leaves 4.8% in net income. However, I calculated the previous year, as shown above, and the 4.8% is an improvement from Fiscal 2015. Additionally, X Company has been able to cut the operating and other expenses by 0.8% from the previous year. In conclusion as the net income increased, the increase in cost of sales is probably not concerning as it can be explained by the increase in sales. The company appears to be on track and improving Note that just explained and analyzed the major percentages. 3. Be sure to show each ratio calculation (select 5 ratios discussed in Chapter 13) AND explain what each ratio means as they relate to your company. Interpret how these ratios affect your company. each ratio means as they relate to your company. Interpret how these ratios affect your company. Example of Ratios: Current Ratio: current assets/ current liabilities $15,000/$10,000 = 1.50. Analysis of the Current Ratio: A current ratio of 1.50 means X Company has the equivalent of $1.50 to pay off $1 of debt. This is a good position for X Company because if they had to pay immediate debt, they would still have money left over. This is a good position to be in. 4. Have a conclusion stating how your company is doing and whether you would invest in this company and why you chose whether to invest or not. 5. Be sure to cite your references. Exxon Mobil Corp. Consolidated Income Statement D DUR NE BAN Exxon Mobil Corp. Consolidated Income Statement US$ in millions 12 months ended: Dec 31, 2019 Dec 31, 2018 Dec 31, 2017 Sales and other operating revenue 255,583 279,332 237,162 Crude oil and product purchases (143,801) (156,172) (128,217) Production and manufacturing expenses (36,826) (36,682) (34,128) Cost of operating revenues (180,627) (192,854) (162,345) Sales based taxes Gross profit 74,956 86,478 74,817 Selling general and administrative expenses (11,398) (11,480) (10,956) Depreciation and depletion (18,998) (18,745) (19,893) Exploration expenses, including dry holes (1,269) (1.466) (1.790) Other taxes and duties (30,525) (32,663) (30,104) Operating income 12,766 22,124 12,074 Income from equity affiliates 5,441 7,355 5,380 Other income 3,914 3,525 1,821 Non-service pension and postretirement benefit expense (1,235) (1,285) Interest expense (830) (601) Income before income taxes 20,056 30,953 18,674 Income taxes (5,282) 19,532) 1,174 Net income including noncontrolling interests 14,774 21,421 19,848 Net income attributable to noncontrolling interests (434) (581) (138) Net income attributable to boxonMobil 14,340 20,840 19,710 Based on10 King date: 2020-02-26). 10 King date: 2019-02-271,10 Kg date: 2018-02-28 10-ing date: 2017-02-22 10. Killing date: 2016-02-24) Dec 31, 2016 218,608 (104,171) (31,927) (136,098) (21,090) 61,420 (10,799) (22,308) (1,467) (25,910) 936 4,806 2,680 Dec 31, 2015 259,488 (130,003) (35,587) (165,590) (22,678) 71,220 (11,501) (18,048) (1,523) (27,265) 12,883 7.644 1,750 (766) (453) 7,969 406 8,375 (535) 7,840 (311) 21,966 15,415) 16,551 (401) 16,150
Step by Step Solution
There are 3 Steps involved in it

Get step-by-step solutions from verified subject matter experts