

Question: 2. Below are results from a regression analysis. The dependent variable is the percent vote for Joe Biden in 2020, measured from 0 to 100.
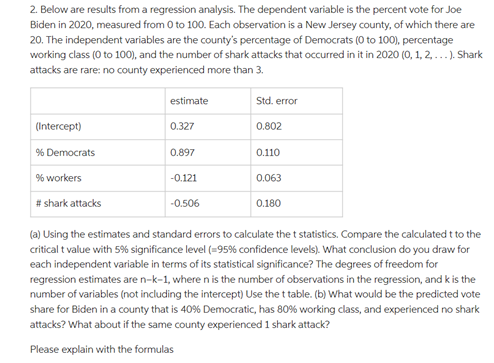
2. Below are results from a regression analysis. The dependent variable is the percent vote for Joe Biden in 2020, measured from 0 to 100. Each observation is a New Jersey county, of which there are 20. The independent variables are the county's percentage of Democrats (0 to 100), percentage working class (0 to 100), and the number of shark attacks that occurred in it in 2020 (0, 1, 2, .. . ). Shark attacks are rare: no county experienced more than 3. estimate Std. error (Intercept) 0.327 0.802 9% Democrats 0.897 0.110 % workers -0.121 0,063 # shark attacks -0.506 0.180 (a) Using the estimates and standard errors to calculate the t statistics. Compare the calculated t to the critical t value with 5% significance level (=95% confidence levels). What conclusion do you draw for each independent variable in terms of its statistical significance? The degrees of freedom for regression estimates are n-k-1, where n is the number of observations in the regression, and k is the number of variables (not including the intercept) Use the t table. (b) What would be the predicted vote share for Biden in a county that is 40% Democratic, has 80% working class, and experienced no shark attacks? What about if the same county experienced 1 shark attack? Please explain with the formulas
Step by Step Solution
There are 3 Steps involved in it

Get step-by-step solutions from verified subject matter experts