

Question: 2. Below, we plot Normal-QQ plots for different samples of 5000 observations each. Each sample has been centered and standardized to have mean 0 and
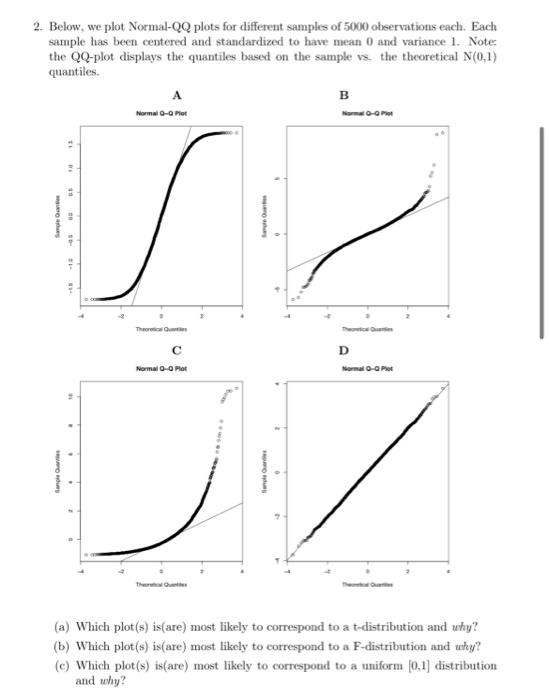
2. Below, we plot Normal-QQ plots for different samples of 5000 observations each. Each sample has been centered and standardized to have mean 0 and variance 1. Note: the QQ-plot displays the quantiles based on the sample vs. the theoretical N(0,1) quantiles. B Normal 0-Q Piet 10-0PM C D Normal 0-0 Plot (a) Which plot(s) is(are) most likely to correspond to a t-distribution and why? (b) Which plot(s) is(are) most likely to correspond to a F-distribution and why? (c) Which plot(s) is(are) most likely to correspond to a uniform [0,1] distribution and why
Step by Step Solution
There are 3 Steps involved in it
1 Expert Approved Answer
Step: 1 Unlock

Question Has Been Solved by an Expert!
Get step-by-step solutions from verified subject matter experts
Step: 2 Unlock
Step: 3 Unlock