

Question: 2. Calculate the test statistic t= ? (Round to two decimal places)3. Calculate the P-value 4. What is your conclusion?_____ the null hypothesis. There _____
2. Calculate the test statistic t= ? (Round to two decimal places)3. Calculate the P-value 4. What is your conclusion?_____ the null hypothesis. There _____ enough evidence at the 1% level of significance to conclude that there _______ a significant linear correlation between vehicle weight and variability in braking distance on a wet surface.
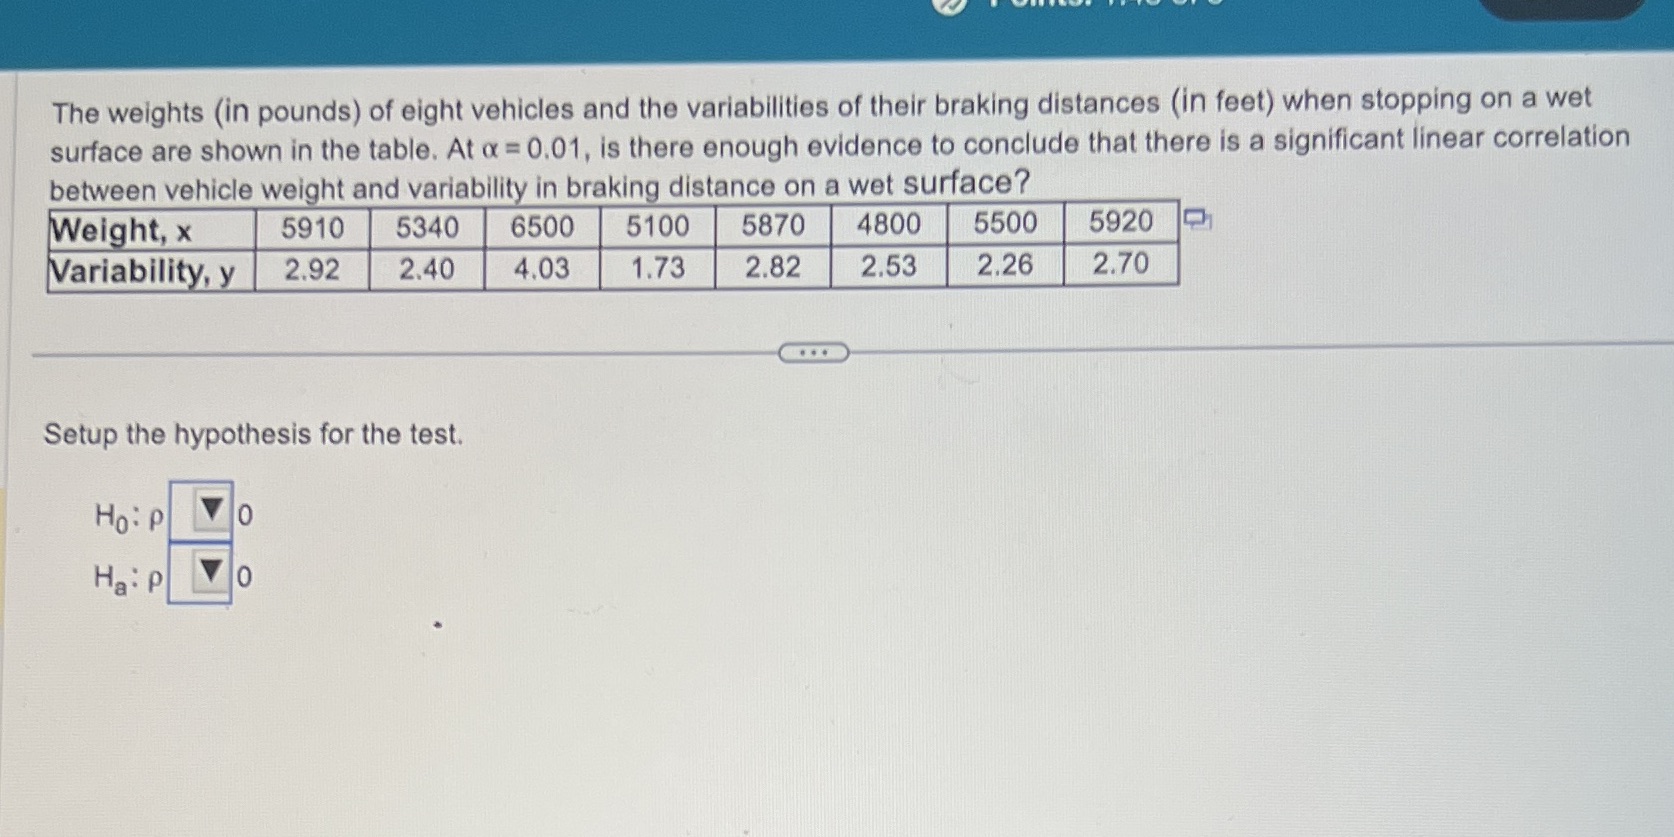
The weights (in pounds) of eight vehicles and the variabilities of their braking distances (in feet) when stopping on a wet surface are shown in the table. At a = 0.01, is there enough evidence to conclude that there is a significant linear correlation between vehicle weight and variability in braking distance on a wet surface? Weight, x 5910 5340 6500 5100 5870 4800 5500 5920 Variability, y 2.92 2.40 4.03 1.73 2.82 2.53 2.26 2.70 Setup the hypothesis for the test. Ho: P 0 Ha: P 0
Step by Step Solution
There are 3 Steps involved in it

Get step-by-step solutions from verified subject matter experts