

Question: . 2 . Calculating marginal revenue from a linear demand curve The blue curve on the following graph represents the demand curve facing a firm
Calculating marginal revenue from a linear demand curve
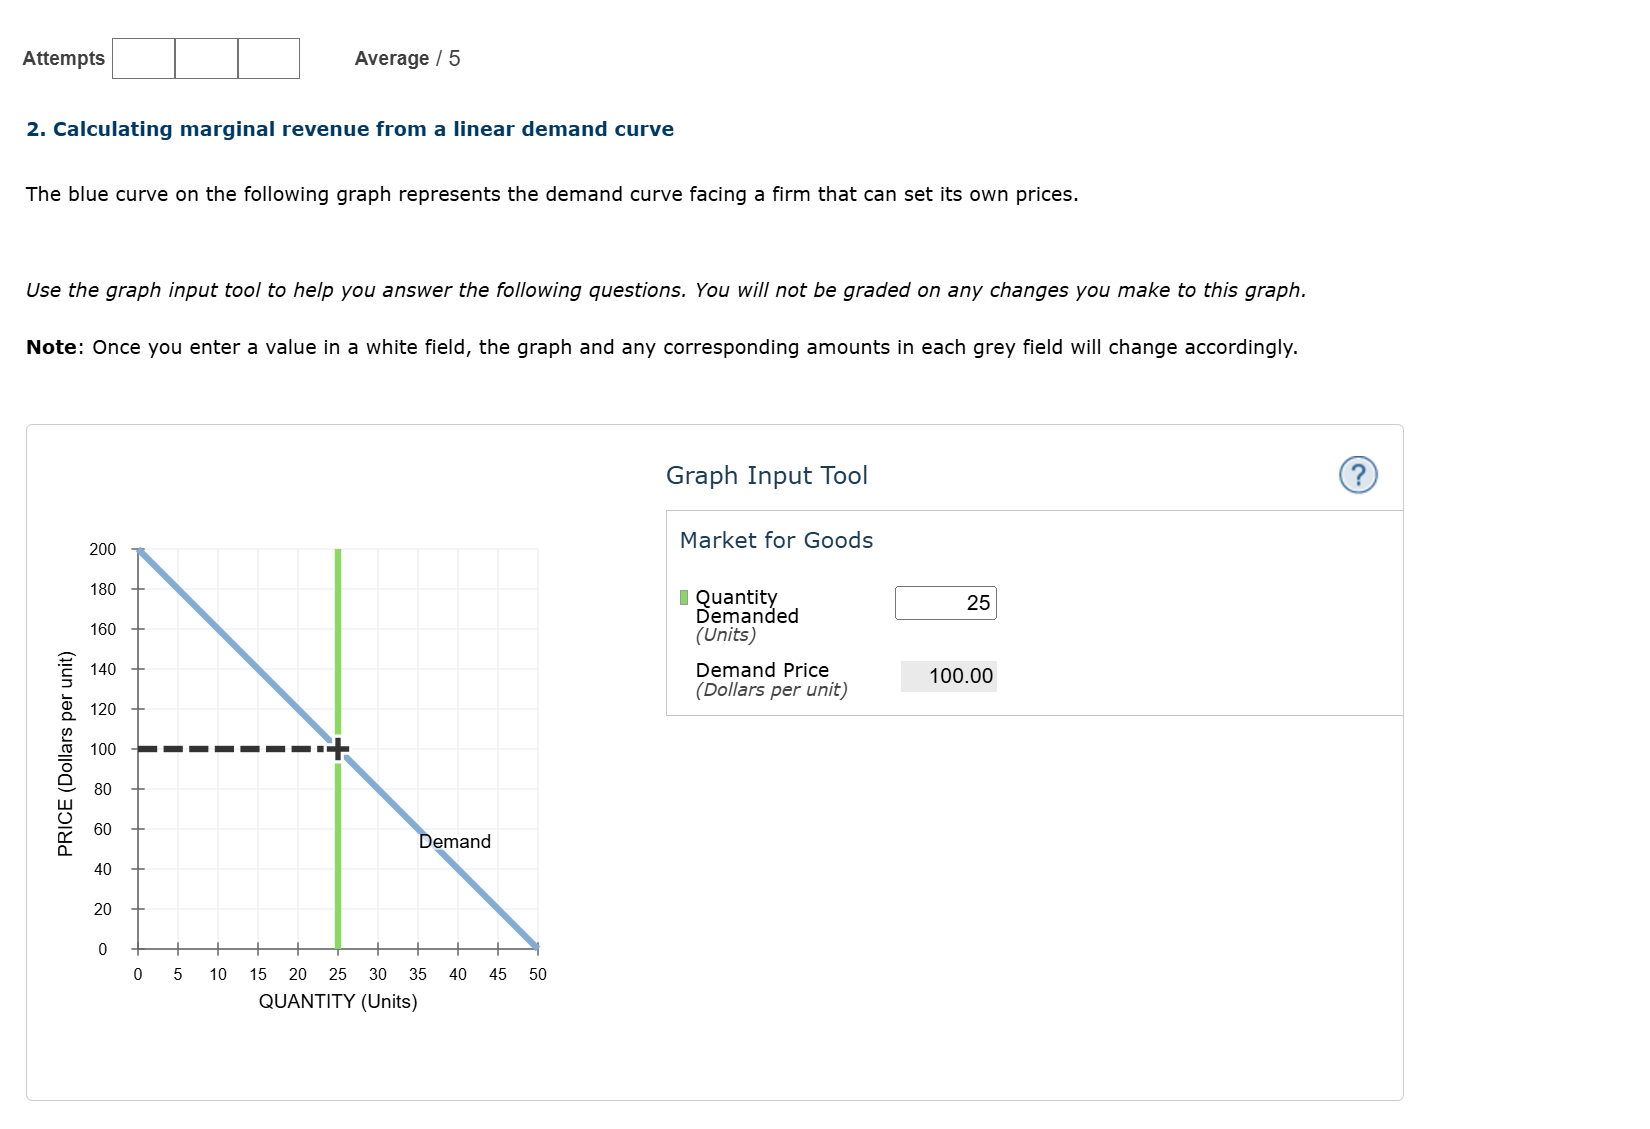
The blue curve on the following graph represents the demand curve facing a firm that can set its own prices.
Use the graph input tool to help you answer the following questions. You will not be graded on any changes you make to this graph.
Note: Once you enter a value in a white field, the graph and any corresponding amounts in each grey field will change accordingly.
PRICE Dollars per unitQUANTITY UnitsDemand
Graph Input Tool
Market for Goods
Quantity Demanded
Units
Demand Price
Dollars per unit
On the graph input tool, change the number found in the Quantity Demanded field to determine the prices that correspond to the production of and units of output. Calculate the total revenue for each of these production levels. Then, on the following graph, use the green points triangle symbol to plot the results.
Total RevenueTOTAL REVENUE DollarsQUANTITY Number of units
Calculate the total revenue if the firm produces versus units. Then, calculate the marginal revenue of the th unit produced.
The marginal revenue of the th unit produced is
Calculate the total revenue if the firm produces versus units. Then, calculate the marginal revenue of the th unit produced.
The marginal revenue of the th unit produced is
Based on your answers from the previous question, and assuming that the marginal revenue curve is a straight line, use the black line plus symbol to plot the firm's marginal revenue curve on the following graph.
Marginal RevenueMARGINAL REVENUE DollarsQUANTITY Units
Comparing your total revenue graph to your marginal revenue graph, you can see that when total revenue is increasing, ma Attempts Average
Calculating marginal revenue from a linear demand curve
The blue curve on the following graph represents the demand curve facing a firm that can set its own prices.
Use the graph input tool to help you answer the following questions. You will not be graded on any changes you make to this graph.
Note: Once you enter a value in a white field, the graph and any corresponding amounts in each grey field will change accordingly.
Graph Input Tool
Market for Goods On the graph input tool, change the number found in the Quantity Demanded field to determine the prices that correspond to the production of and units of output. Calculate the total revenue for each of these production levels. Then, on the following graph, use the green points triangle symbol to plot the results.
Total Revenue
Calculate the total revenue if the firm produces versus units. Then, calculate the marginal revenue of the th unit produced.
The marginal revenue of the th unit produced is
Calculate the total revenue if the firm produces versus units. Then, calculate the marginal revenue of the th unit produced.
The marginal revenue of the th unit produced is ased on your answers from the previous question, and assuming that the marginal revenue curve is a straight line, use the black line plus symbol plot the firm's marginal revenue curve on the following graph.
omparing your total revenue graph to your marginal revenue graph, you can see that when total revenue is increasing, marginal revenue is
Step by Step Solution
There are 3 Steps involved in it
1 Expert Approved Answer
Step: 1 Unlock

Question Has Been Solved by an Expert!
Get step-by-step solutions from verified subject matter experts
Step: 2 Unlock
Step: 3 Unlock