

Question: 2. Complete the ratio analysis in last page based on the income statement & balance sheet given below. For each ratio, show the calculation and
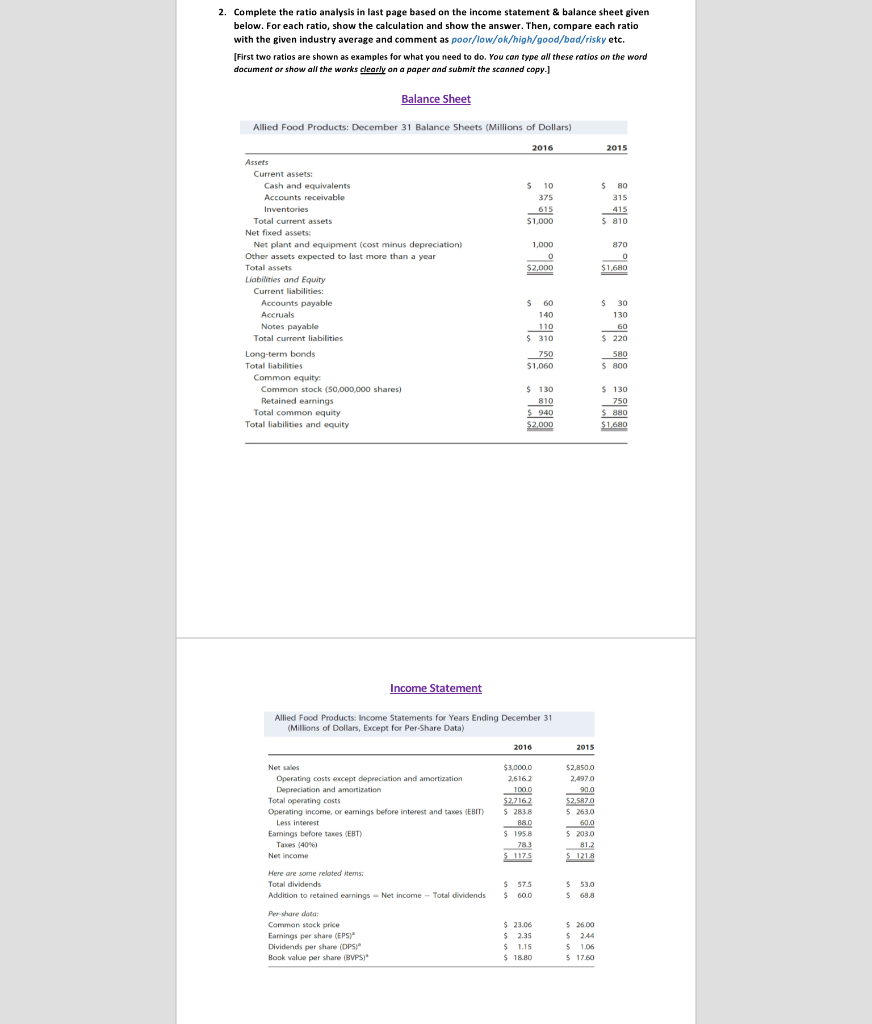
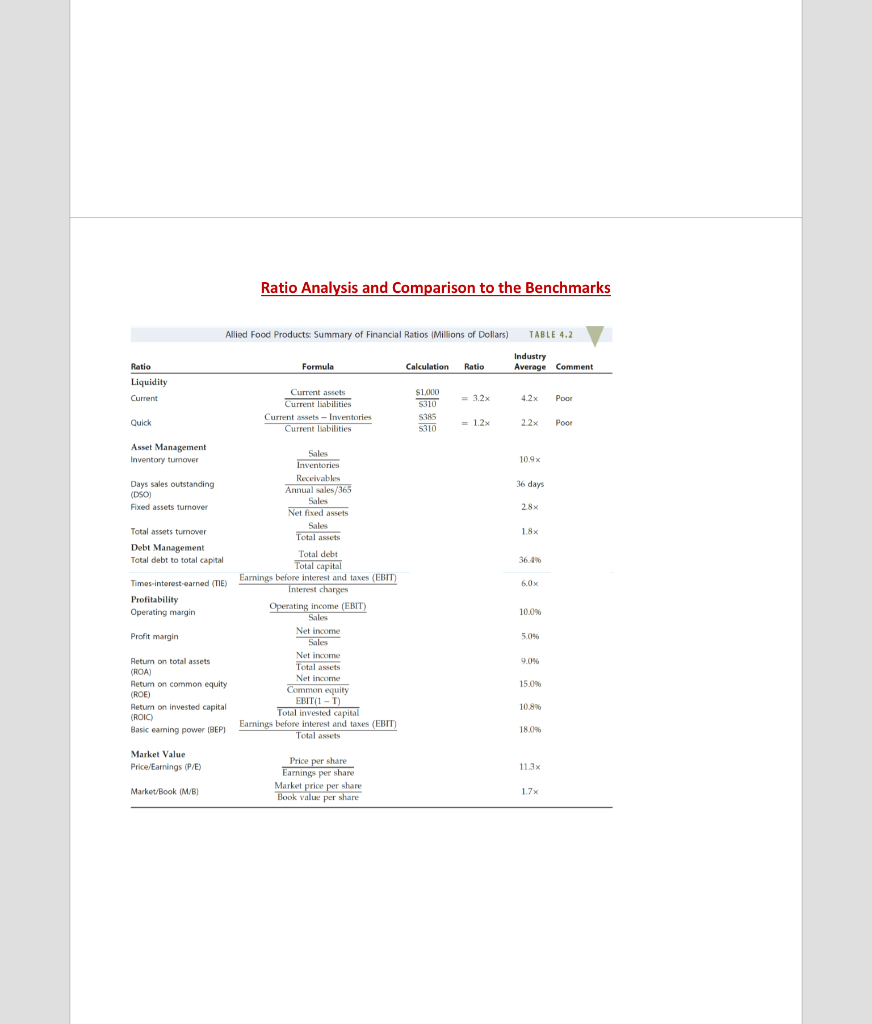
2. Complete the ratio analysis in last page based on the income statement & balance sheet given below. For each ratio, show the calculation and show the answer. Then, compare each ratio with the given industry average and comment as poor/low/ok/high/good/bad/risky etc. [First two ratios are shown as examples for what you need to do. You can type all these ratios on the word document or show all the works clearly on a paper and submit the scanned copy. Balance Sheet 2015 $ 80 315 415 $ 810 870 $1,680 Allied Food Products: December 31 Balance Sheets (Millions of Dollars) 2016 Assets Current assets: Cash and equivalents $ 10 Accounts receivable Inventories 615 Total current assets $1.000 Net fixed assets Net plant and equipment (cost minus depreciation 1.000 Other assets expected to last more than a year Total assets $2,000 Liabilities and Equity Current liabilities: Accounts payable $ 60 Accruals Notes payable 110 Total current liabilities $ 310 Long-term bonds Total liabilities $1.060 Common equity Common stock (50.000.000 shares) $ 130 Retained earnings 810 Total common equity Total liabilities and equity $2.000 $ 140 30 130 $ 220 750 50 $ 800 $ 130 750 $ 880 $1680 Income Statement Allied Food Products: Income Statements for Years Ending December 31 (Millions of Dollars, Except for Per-Share Data) 2010 S1000D 26162 Net als Operating costs except depreciation and amortization Depreciation and amortization Total operating costs Operating income, or earnings before interest and taxes EBIT) Less interest Earings before the (EST) 5238 income Here are some related items Total dividends Addition to retained earnings - Net Income - Total dividends 5 $ 575 $ 600 53.0 63. 5 Common stock price Earnings per share (EPS) Dividends per share (DPS" Book value per share (BVPS)" $ 23.06 $ 2.35 $ 1.15 $ 1.0 $ 26,00 $ 244 $ 105 $17.60 Ratio Analysis and Comparison to the Benchmarks Allied Food Products: Summary of Financial Ratios Millions of Dollars) TABLE 4.2 Formula Calculation Ratio Industry Average Comment Ratio Liquidity Current 4.2x Poor Current assets Current abilities Current Inventories Current liabilities $1,000 S310 S385 S010 Quick = 1.2% 2.2 Poor Asset Management Inventory turnover 10.9% 36 days Days sales outstanding (DSO) Fixed assets turnover 2.8% 1.8% Total assets turnover Debt Management Total debt to total capital 36.4% . Times-interest-earned (TIE) Profitability Operating margin Sales Inventories Receivables Annual sales/365 Sales Net fixed assets Sales Total assets Total debt Total capital Earnings before interest and taxes (EBIT) Interest charges Operating income (EBIT) Sales Net Income Sales Net income Total assets Net income Common equity EBIT/1 - Total invested capital Earnings before interest and taxes (EBIT) Total assets 10.0% Profit margin 5.0% 90% 15.0% Retum on total assets (ROA) Return on common equity (ROE) Retum on invested capital (ROIC) Basic eaming power (BEP) 10.8% 18.0% Market Value Price/Earnings (P/E) 11.3x Price per share Earnings per share Market price per share Book value per share Market/Book (M/B) 1.7%
Step by Step Solution
There are 3 Steps involved in it

Get step-by-step solutions from verified subject matter experts