

Question: 2. Complete the table below. Consider the scores obtained in Math(X) and Statistics (Y) subjects by 10 students. Observation Math Score (X) Stat Score (Y)
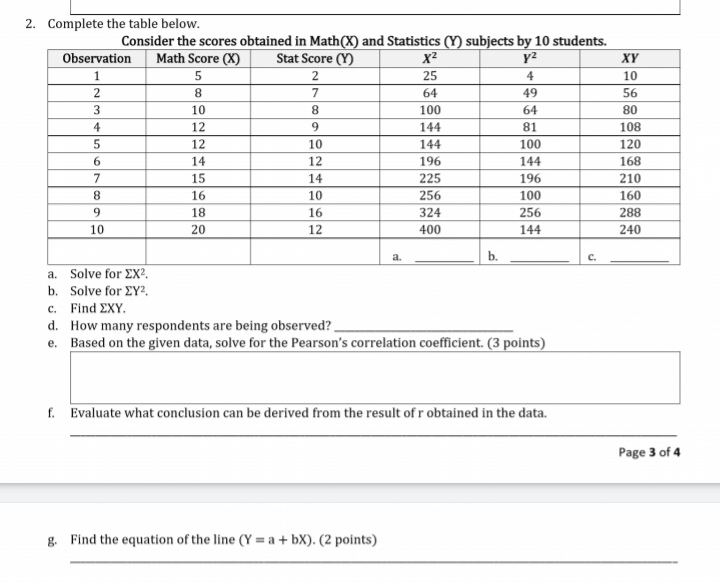
2. Complete the table below. Consider the scores obtained in Math(X) and Statistics (Y) subjects by 10 students. Observation Math Score (X) Stat Score (Y) X2 1 y2 5 XY 2 25 2 4 8 10 7 3 64 10 49 8 56 4 100 64 12 80 9 5 144 12 81 10 108 6 144 14 100 120 12 7 196 15 144 168 14 8 225 16 196 10 210 9 256 18 100 160 16 10 324 20 256 288 12 400 144 240 a. a. Solve for EX?. b. C. b. Solve for EY2. c. Find EXY. d. How many respondents are being observed? e. Based on the given data, solve for the Pearson's correlation coefficient. (3 points) f. Evaluate what conclusion can be derived from the result of r obtained in the data. Page 3 of 4 g. Find the equation of the line (Y = a + bX). (2 points)
Step by Step Solution
There are 3 Steps involved in it

Get step-by-step solutions from verified subject matter experts