

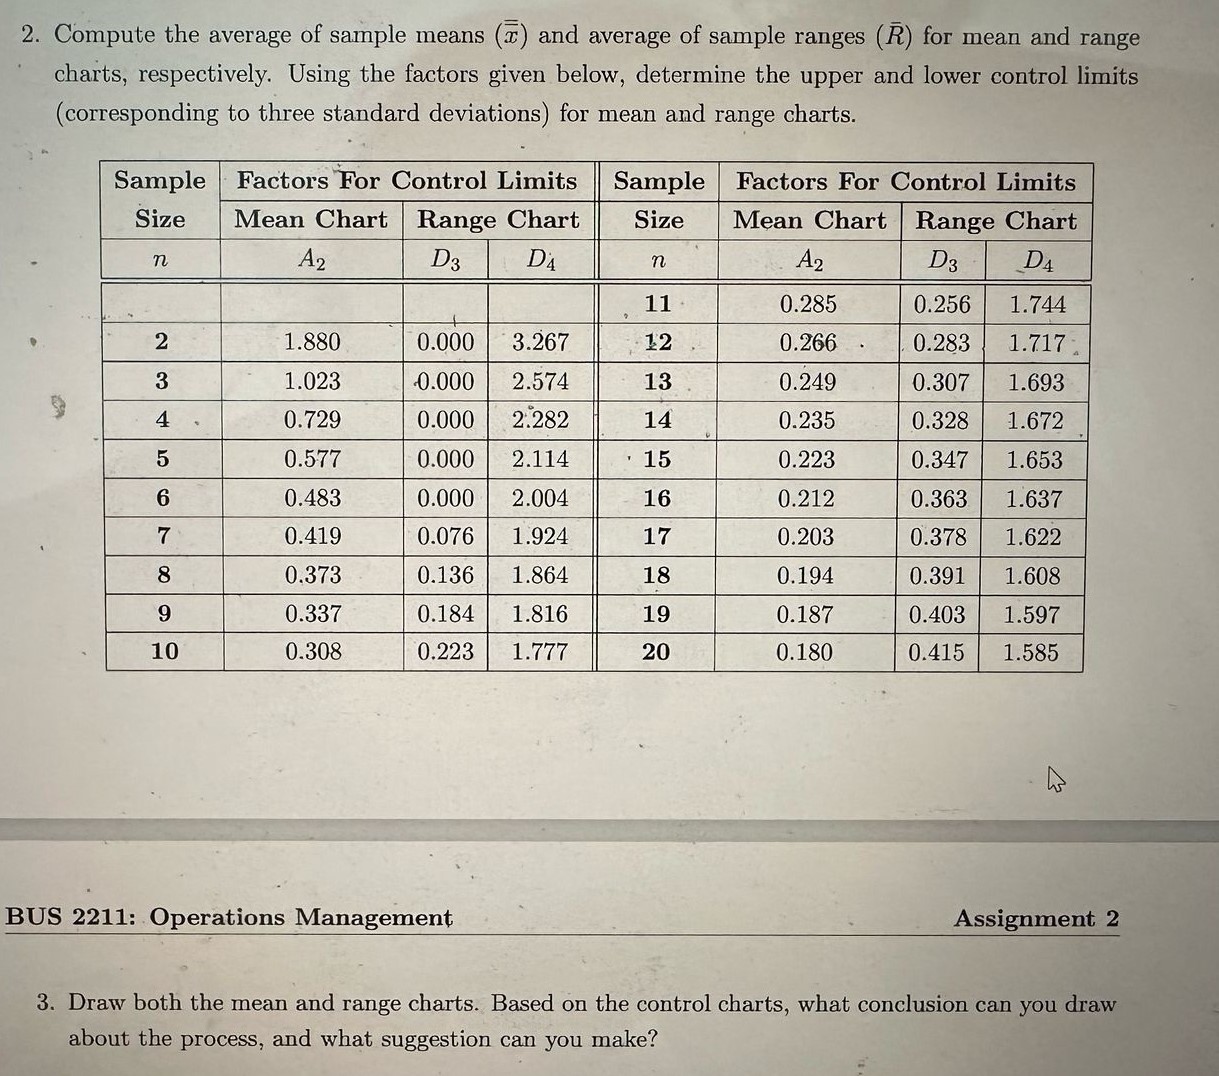
Question: 2 . Compute the average of sample means ( = x ) and average of sample ranges ( R ) for mean and range charts,
Compute the average of sample means x and average of sample rangesR for mean and range charts, respectively. Using the factors given below, determine the upper and lower control limits corresponding to three standard deviationsfor mean and range charts. Sample Factors For Control Limits Sample Factors ForControlLimits Size MeanChart RangeChart Size MeanChart RangeChart n A D D n A D D Draw both the mean and range charts. Based on the control charts, what conclusion can you draw about the process, and what suggestion can you make?
Step by Step Solution
There are 3 Steps involved in it
1 Expert Approved Answer
Step: 1 Unlock

Question Has Been Solved by an Expert!
Get step-by-step solutions from verified subject matter experts
Step: 2 Unlock
Step: 3 Unlock