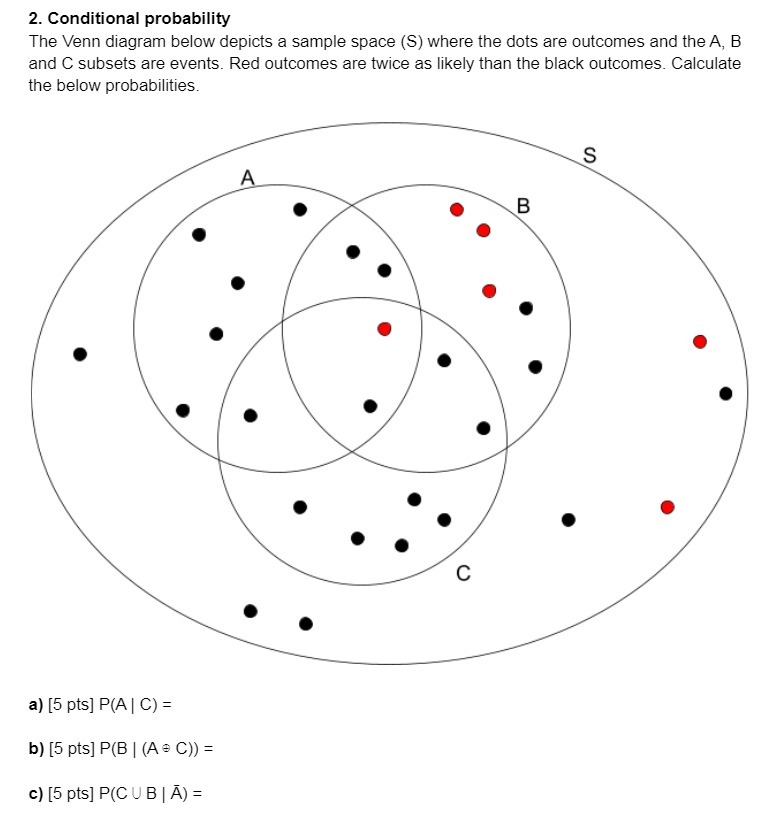
Question: 2. Conditional probability The Venn diagram below depicts a sample space (S) where the dots are outcomes and the A, B and C subsets are

2. Conditional probability The Venn diagram below
2. Conditional probability The Venn diagram below depicts a sample space (S) where the dots are outcomes and the A, B and C subsets are events. Red outcomes are twice as likely than the black outcomes. Calculate the below probabilities. S A B C a) [5 pts] P(A | C) = b) [5 pts] P(B | (A = C)) = c) [5 pts] P(C U B | A) =

Step by Step Solution

There are 3 Steps involved in it

1 Expert Approved Answer
Step: 1 Unlock blur-text-image
Question Has Been Solved by an Expert!

Get step-by-step solutions from verified subject matter experts

Step: 2 Unlock
Step: 3 Unlock

Students Have Also Explored These Related Mathematics Questions!