

Question: 2. Consider a data set that contains 50 observations with 3 variables: Y (response), x1 (numerical predictor) and x2 (categorical predictor). Predictor x2 represents the
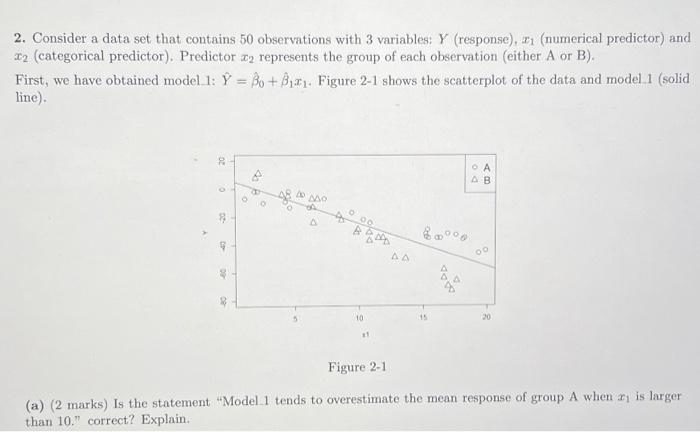
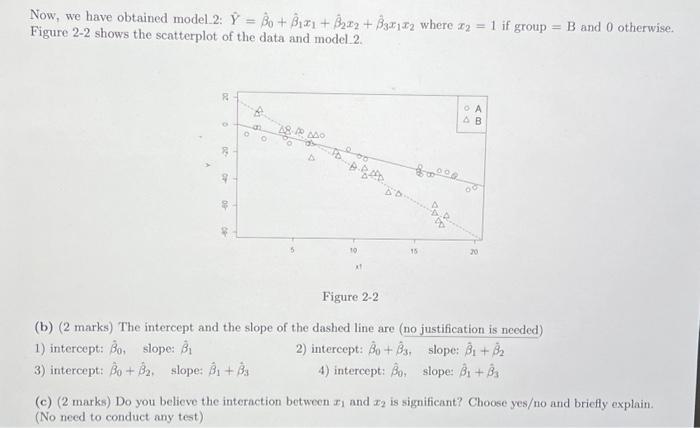
2. Consider a data set that contains 50 observations with 3 variables: Y (response), x1 (numerical predictor) and x2 (categorical predictor). Predictor x2 represents the group of each observation (either A or B). First, we have obtained model 1: Y^=^0+^1x1. Figure 2-1 shows the scatterplot of the data and model. 1 (solid line). Figure 2-1 (a) ( 2 marks) Is the statement "Model 1 tends to overestimate the mean response of group A when x1 is larger than 10." correct? Explain. Now, we have obtained model. 2: Y^=^0+^1x1+^2x2+^3x1x2 where x2=1 if group =B and 0 otherwise. Figure 2-2 shows the scatterplot of the data and model 2 . Figure 2-2 (b) (2 marks) The intercept and the slope of the dashed line are (no justification is needed) 1) intercept: ^0, slope: ^1 2) intercept: ^0+^3, slope: ^1+^2 3) intercept: ^0+^2, slope: ^1+^3 4) intercept: ^0, slope: ^1+^3 (c) (2 marks) Do you believe the interaction betwoen x1 and x2 is significant? Choose yeso and briefly explain. (No need to conduct any test)
Step by Step Solution
There are 3 Steps involved in it

Get step-by-step solutions from verified subject matter experts