

Question: 2. Consider Figure A and associated Table A. What is the optimal objective function value? A. 170,000 B. 10,000 C. 20,000 D. 58,000 E. none
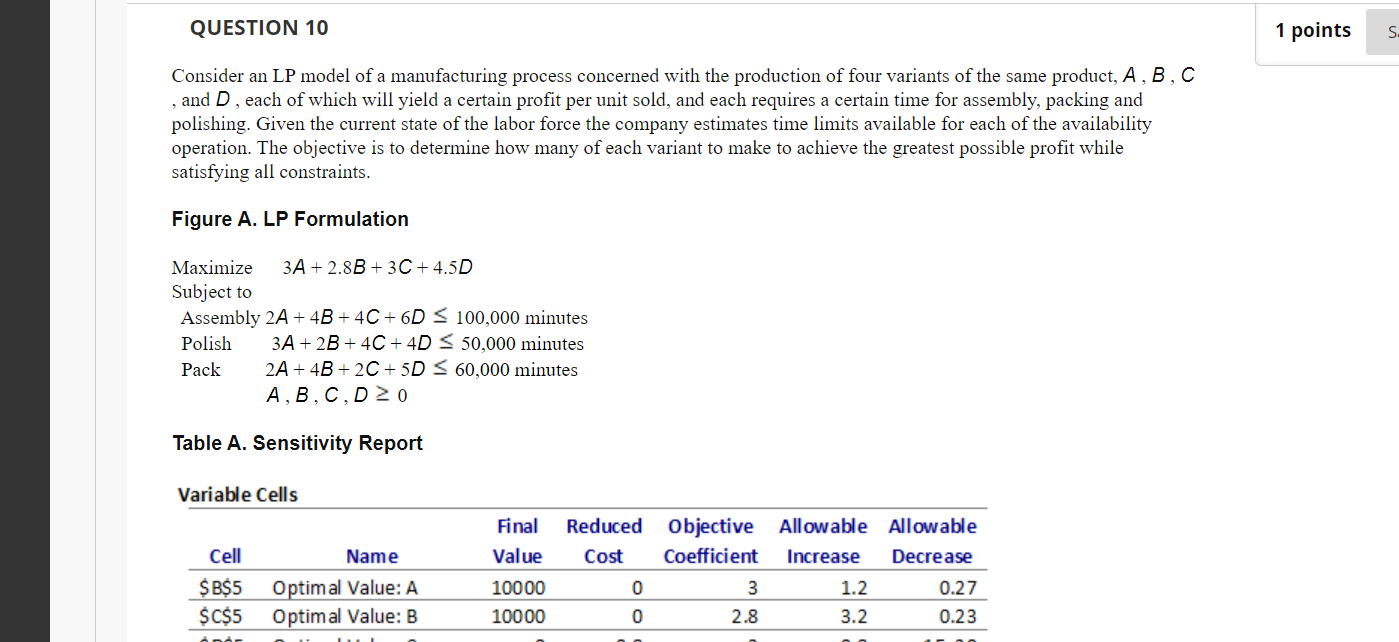
 2.
2.
Consider Figure A and associated Table A. What is the optimal objective function value?
| A. | 170,000 | |
| B. | 10,000 | |
| C. | 20,000 | |
| D. | 58,000 | |
| E. | none of the above |
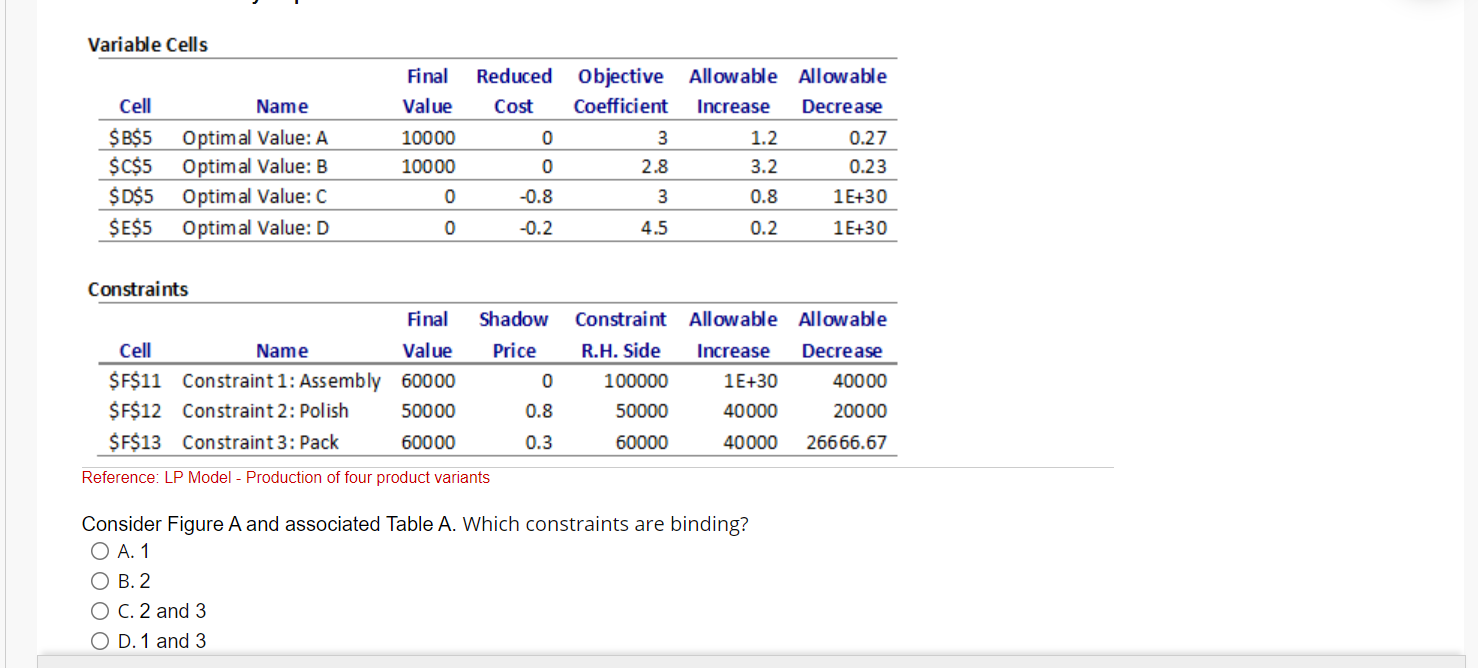
Consider Figure A and associated Table A. By how much would the profit contribution of product variant B has to increase before it will be profitable to produce B?
| A. | 0 | |
| B. | 3.2 | |
| C. | 0.23 | |
| D. | 10000 | |
| E. | none of the above |
Consider Figure A and associated Table A. Suppose that due to machine breakdown the available assembly time is now only 70,000 minutes. What impact will this have on the current optimal objective function value?
| A. | no change | |
| B. | a decrease of $18000 | |
| C. | an increase of $100000 | |
| D. | an increase of $82000 | |
| E. | none of the above |
Step by Step Solution
There are 3 Steps involved in it
1 Expert Approved Answer
Step: 1 Unlock

Question Has Been Solved by an Expert!
Get step-by-step solutions from verified subject matter experts
Step: 2 Unlock
Step: 3 Unlock