

Question: 2. Consider Table 5 Table 5 Stock 1 Stock 2 8% Riskless asset 2% Expected return 4% Standard deviation of the return 5% 0% 3%
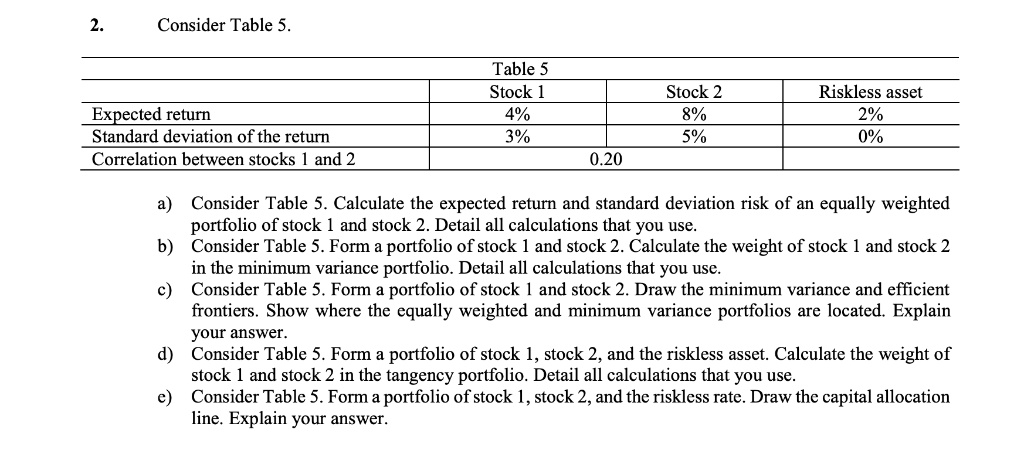
2. Consider Table 5 Table 5 Stock 1 Stock 2 8% Riskless asset 2% Expected return 4% Standard deviation of the return 5% 0% 3% Correlation between stocks 1 and 2 0.20 Consider Table 5. Calculate the expected return and standard deviation risk of an equally weighted portfolio of stock 1 and stock 2. Detail all calculations that you use b) a) Consider Table 5. Form a portfolio of stock 1 and stock 2. Calculate the weight of stock 1 and stock 2 in the minimum variance portfolio. Detail all calculations that you use c) Consider Table 5. Form a portfolio of stock 1 and stock 2. Draw the minimum variance and efficient frontiers. Show where the equally weighted and minimum variance portfolios are located. Explain your answer Consider Table 5. Form a portfolio of stock 1, stock 2, and the riskless asset. Calculate the weight of stock 1 and stock 2 in the tangency portfolio. Detail all calculations that you use e) d) Consider Table 5. Form a portfolio of stock 1, stock 2, and the riskless rate. Draw the capital allocation line. Explain your answer 2. Consider Table 5 Table 5 Stock 1 Stock 2 8% Riskless asset 2% Expected return 4% Standard deviation of the return 5% 0% 3% Correlation between stocks 1 and 2 0.20 Consider Table 5. Calculate the expected return and standard deviation risk of an equally weighted portfolio of stock 1 and stock 2. Detail all calculations that you use b) a) Consider Table 5. Form a portfolio of stock 1 and stock 2. Calculate the weight of stock 1 and stock 2 in the minimum variance portfolio. Detail all calculations that you use c) Consider Table 5. Form a portfolio of stock 1 and stock 2. Draw the minimum variance and efficient frontiers. Show where the equally weighted and minimum variance portfolios are located. Explain your answer Consider Table 5. Form a portfolio of stock 1, stock 2, and the riskless asset. Calculate the weight of stock 1 and stock 2 in the tangency portfolio. Detail all calculations that you use e) d) Consider Table 5. Form a portfolio of stock 1, stock 2, and the riskless rate. Draw the capital allocation line. Explain your
Step by Step Solution
There are 3 Steps involved in it

Get step-by-step solutions from verified subject matter experts