

Question: 2. Consider the cash flow table below. Each cash flow value is a random variable. The mean and variance of each is given. YEAR 0
2. Consider the cash flow table below. Each cash flow value is a random variable. The mean and variance of each is given. YEAR 0 1 2 3 4 Mean -$153,000 $50,000 $60,000 $70,000 $10,000 Variance 300,000 400,000 200,000 200,000 Use the values and a MARR of 10% to: a) Find the mean and variance of the NPW. b) Assuming NPW is normally distributed, find the probability that NPW 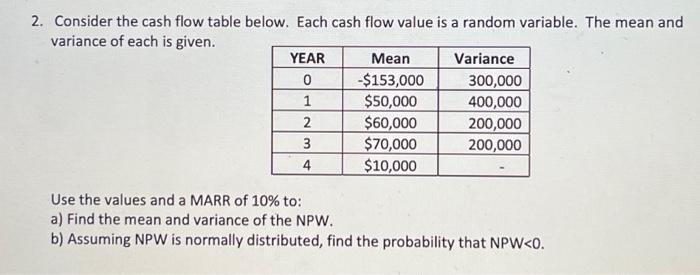
2. Consider the cash flow table below. Each cash flow value is a random variable. The mean and variance of each is given. Use the values and a MARR of 10% to: a) Find the mean and variance of the NPW. b) Assuming NPW is normally distributed, find the probability that NPW Step by Step Solution
There are 3 Steps involved in it
1 Expert Approved Answer
Step: 1 Unlock

Question Has Been Solved by an Expert!
Get step-by-step solutions from verified subject matter experts
Step: 2 Unlock
Step: 3 Unlock