

Question: 2.) Consider the expected returns, standard deviations, Sharpe ratios, and correlation matrix for three stocks: Stock 1 2 3 E(R) 0.13 0.16 0.24 O; 0.21
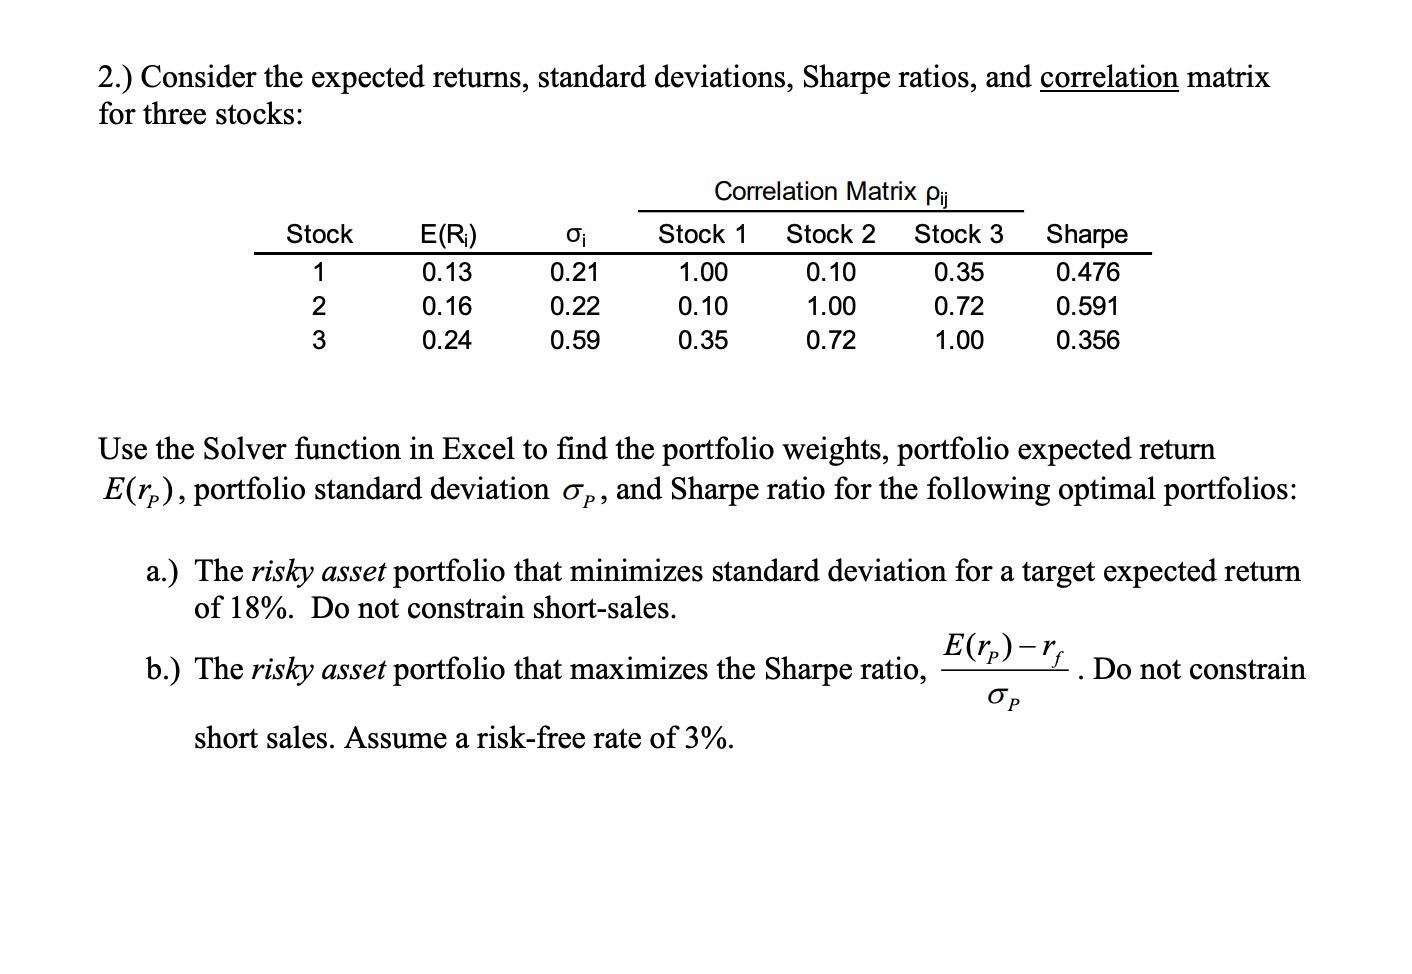
2.) Consider the expected returns, standard deviations, Sharpe ratios, and correlation matrix for three stocks: Stock 1 2 3 E(R) 0.13 0.16 0.24 O; 0.21 0.22 0.59 Correlation Matrix Pij Stock 1 Stock 2 Stock 3 1.00 0.10 0.35 0.10 1.00 0.72 0.35 0.72 1.00 Sharpe 0.476 0.591 0.356 Use the Solver function in Excel to find the portfolio weights, portfolio expected return E(rp), portfolio standard deviation Op, and Sharpe ratio for the following optimal portfolios: a.) The risky asset portfolio that minimizes standard deviation for a target expected return of 18%. Do not constrain short-sales. Err)- b.) The risky asset portfolio that maximizes the Sharpe ratio, Do not constrain OP short sales. Assume a risk-free rate of 3%. 2.) Consider the expected returns, standard deviations, Sharpe ratios, and correlation matrix for three stocks: Stock 1 2 3 E(R) 0.13 0.16 0.24 O; 0.21 0.22 0.59 Correlation Matrix Pij Stock 1 Stock 2 Stock 3 1.00 0.10 0.35 0.10 1.00 0.72 0.35 0.72 1.00 Sharpe 0.476 0.591 0.356 Use the Solver function in Excel to find the portfolio weights, portfolio expected return E(rp), portfolio standard deviation Op, and Sharpe ratio for the following optimal portfolios: a.) The risky asset portfolio that minimizes standard deviation for a target expected return of 18%. Do not constrain short-sales. Err)- b.) The risky asset portfolio that maximizes the Sharpe ratio, Do not constrain OP short sales. Assume a risk-free rate of 3%
Step by Step Solution
There are 3 Steps involved in it

Get step-by-step solutions from verified subject matter experts