

Question: 2. Consider the information in Table1. Table 1 Standard Deviation of Stock Stock Correlation with Market Portfolio 0.75 0.20 Stock 20% 15% 14% 0% 49%
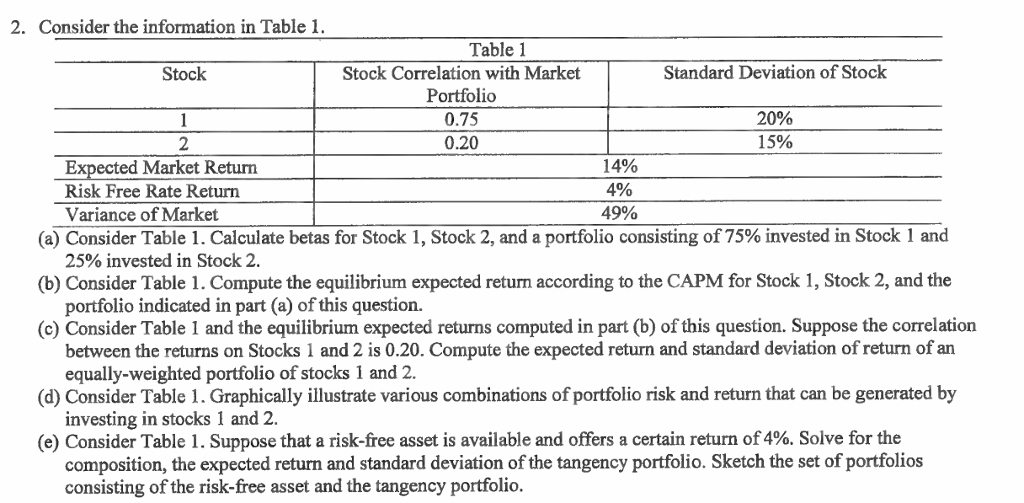
2. Consider the information in Table1. Table 1 Standard Deviation of Stock Stock Correlation with Market Portfolio 0.75 0.20 Stock 20% 15% 14% 0% 49% ected Market Return Risk Free Rate Return (a) Consider Table 1 . Calculate betas for Stock 1, Stock 2, and a portfolio consisting of 75% invested in Stock 1 and (b) Consider Table 1. Compute the equilibrium expected return according to the CAPM for Stock 1, Stock 2, and the (c) Consider Table 1 and the equilibrium expected returns computed in part (b) of this question. Suppose the correlation Variance of Market 25% invested in Stock 2 portfolio indicated in part (a) of this question. between the returns on Stocks 1 and 2 is 0.20. Compute the expected return and standard deviation of return of an equally-weighted portfolio of stocks 1 and 2. investing in stocks 1 and 2. composition, the expected return and standard deviation of the tangency portfolio. Sketch the set of portfolios (d) Consider Table 1. Graphically illustrate various combinations of portfolio risk and return that can be generated by (e) Consider Table 1 . Suppose that a risk-free asset is available and offers a certain return of 4%. Solve for the consisting of the risk-free asset and the tangency portfolio
Step by Step Solution
There are 3 Steps involved in it

Get step-by-step solutions from verified subject matter experts