

Question: 2 . Consider the network with meters at locations as shown in Figure 1 on page 2 . The measurement values and standard deviations (
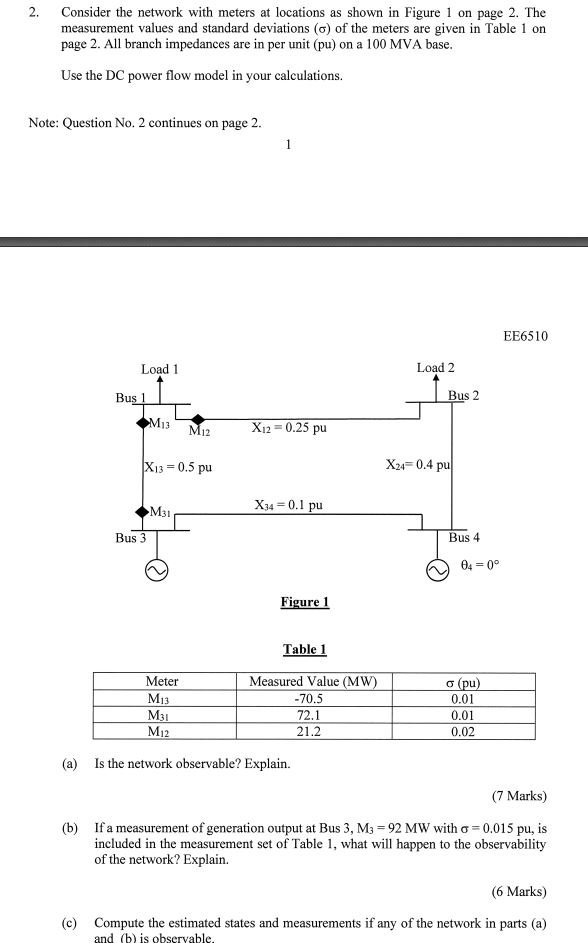
Consider the network with meters at locations as shown in Figure on page The measurement values and standard deviations sigma of the meters are given in Table on page All branch impedances are in per unit pu on a MVA base.
Use the DC power flow model in your calculations.
Note: Question No continues on page
Table
a Is the network observable? Explain.
b If a measurement of generation output at Bus mathrmMmathrmMW with sigmamathrmpu is included in the measurement set of Table what will happen to the observability of the network? Explain.
c Compute the estimated states and measurements if any of the network in parts a and b is observable.
Step by Step Solution
There are 3 Steps involved in it
1 Expert Approved Answer
Step: 1 Unlock

Question Has Been Solved by an Expert!
Get step-by-step solutions from verified subject matter experts
Step: 2 Unlock
Step: 3 Unlock