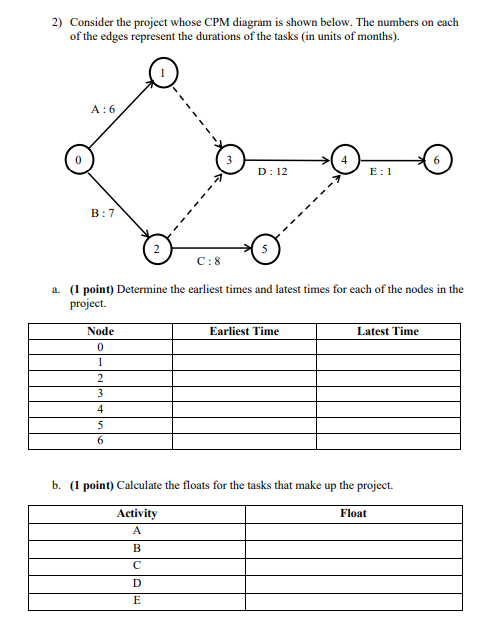
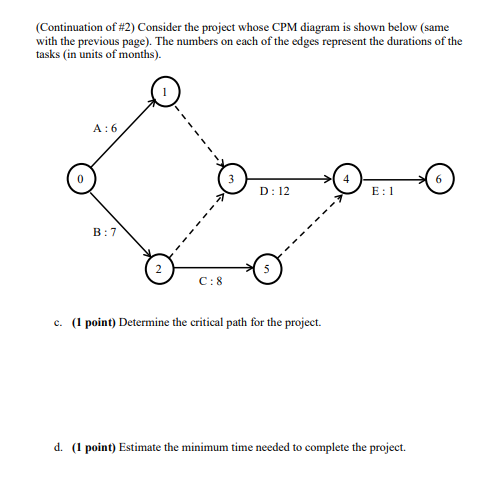
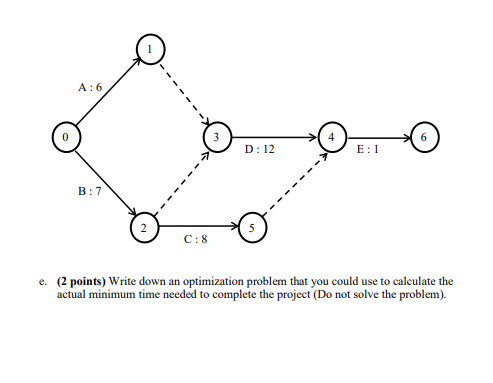
Question: 2) Consider the project whose CPM diagram is shown below. The numbers on each of the edges represent the durations of the tasks (in units

2) Consider the project whose CPM diagram is

2) Consider the project whose CPM diagram is

2) Consider the project whose CPM diagram is

2) Consider the project whose CPM diagram is shown below. The numbers on each of the edges represent the durations of the tasks (in units of months). A:6 D: 12 E: 1 B:7 C:8 a. (1 point) Determine the earliest times and latest times for each of the nodes in the project Earliest Time Latest Time Node 0 1 2 3 4 5 6 b. (1 point) Calculate the floats for the tasks that make up the project. Float Activity A B D E (Continuation of #2) Consider the project whose CPM diagram is shown below (same with the previous page). The numbers on each of the edges represent the durations of the tasks in units of months). A:6 D: 12 E: 1 B:7 5 C:8 c. (1 point) Determine the critical path for the project. d. (1 point) Estimate the minimum time needed to complete the project. A:6 D: 12 E: 1 B:7 C:8 e. (2 points) Write down an optimization problem that you could use to calculate the actual minimum time needed to complete the project (Do not solve the problem)

Step by Step Solution

There are 3 Steps involved in it

1 Expert Approved Answer
Step: 1 Unlock blur-text-image
Question Has Been Solved by an Expert!

Get step-by-step solutions from verified subject matter experts

Step: 2 Unlock
Step: 3 Unlock

Students Have Also Explored These Related General Management Questions!