

Question: 2) Consider the sample data set below: 767 770 761 760 771 768 776 771 756 770 763 760 747 766 754 771 771 778
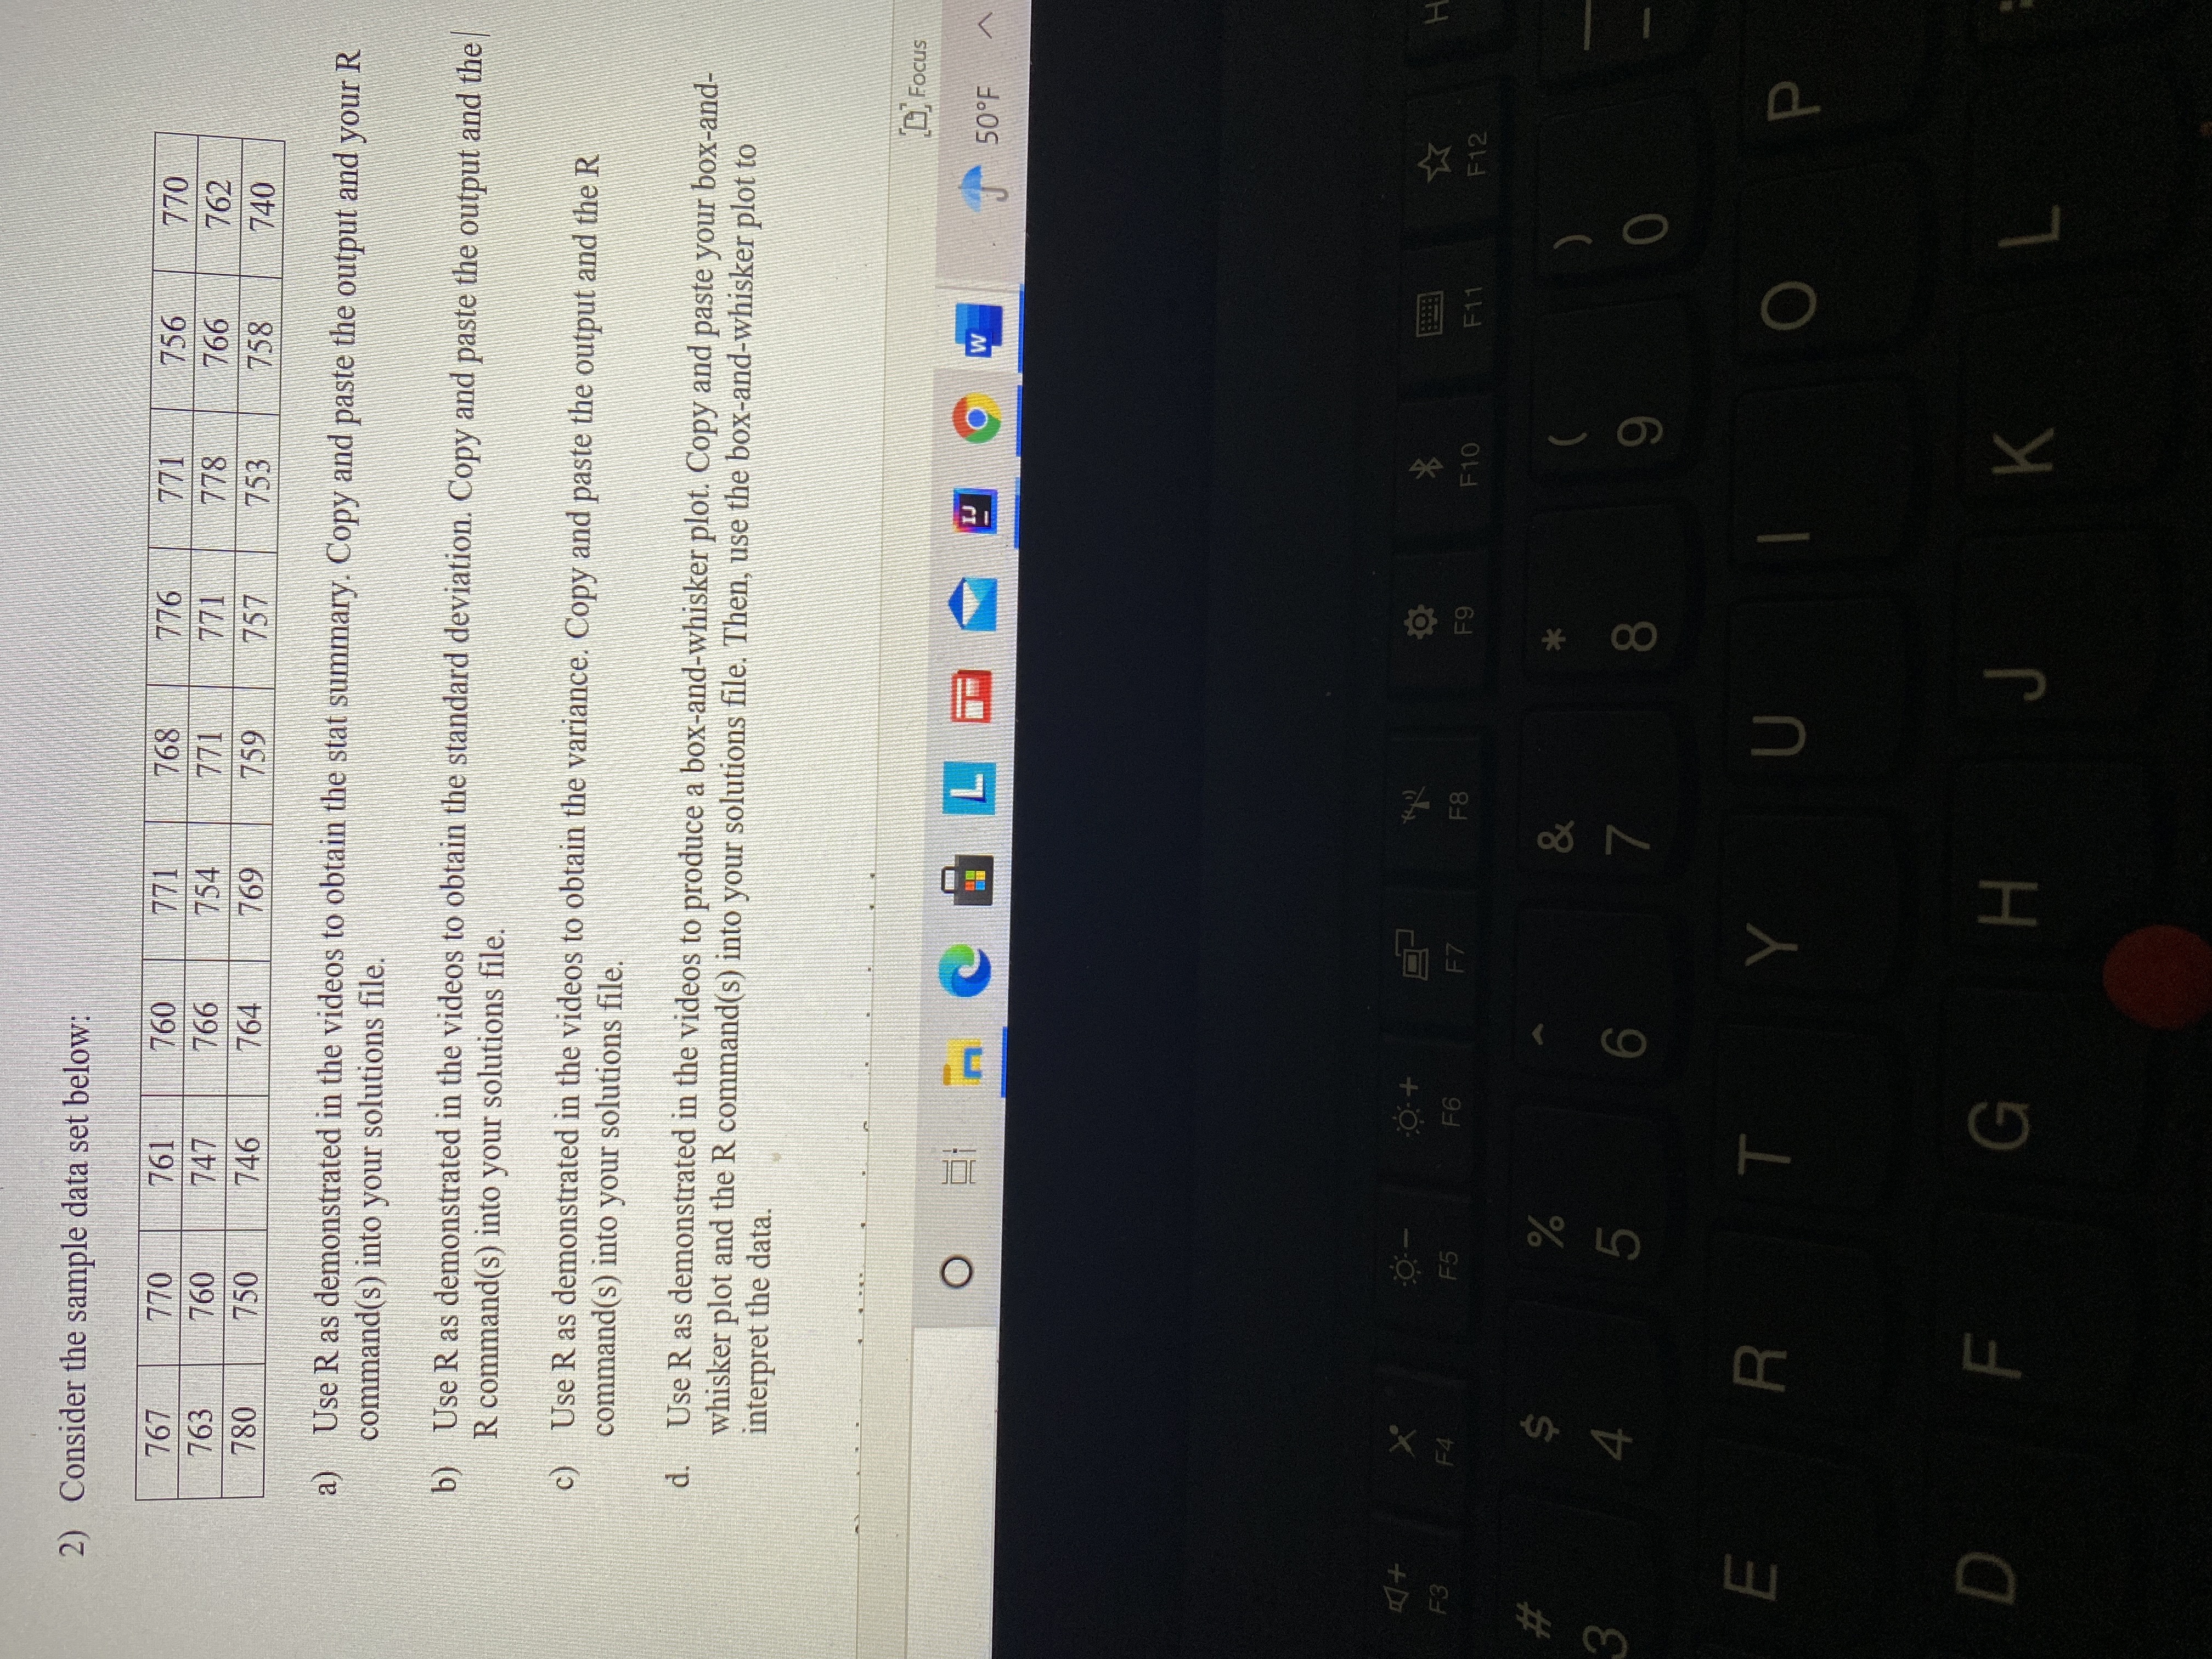
2) Consider the sample data set below: 767 770 761 760 771 768 776 771 756 770 763 760 747 766 754 771 771 778 766 762 780 750 746 764 769 759 757 753 758 740 a) Use R as demonstrated in the videos to obtain the stat summary. Copy and paste the output and your R command(s) into your solutions file. b) Use R as demonstrated in the videos to obtain the standard deviation. Copy and paste the output and the R command(s) into your solutions file. c) Use R as demonstrated in the videos to obtain the variance. Copy and paste the output and the R command(s) into your solutions file. d. Use R as demonstrated in the videos to produce a box-and-whisker plot. Copy and paste your box-and- whisker plot and the R command(s) into your solutions file. Then, use the box-and-whisker plot to interpret the data. Focus W 50OF X O- + O F3 F4 F5 -6 F7 F8 10 F11 F12 S % & 3 4 5 6 7 8 CO O E R T Y U O P D F G H J K L
Step by Step Solution
There are 3 Steps involved in it

Get step-by-step solutions from verified subject matter experts