

Question: 2' Consider the Solow model. Suppose the eeonorny is initially in a stead}r state. Then, the savings rate increases from 1 to 2 > s1.
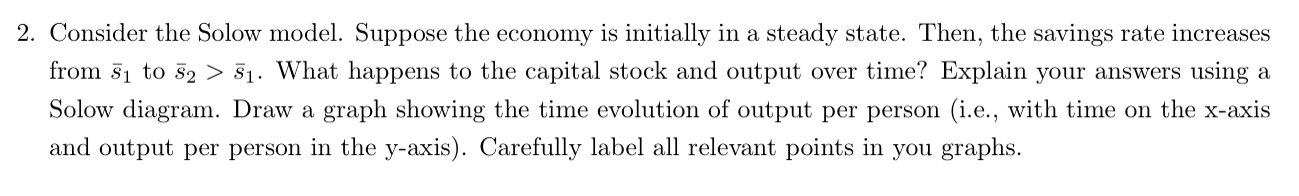
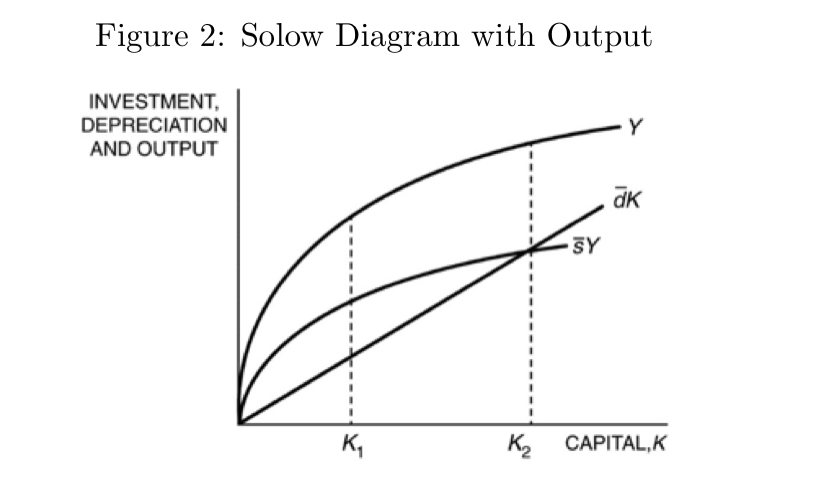


2' Consider the Solow model. Suppose the eeonorny is initially in a stead}r state. Then, the savings rate increases from 1 to 2 > s1. \\Nhat happens to the capital stock and output. over time? Explain your answers using a Solow diagram. Draw a graph sl'rowing the time evolution of output per person (i.e., with time on the xaxis and output per person in the yeaxis). Carefully label all relevant. points in you graphs. Figure 2: Solow Diagram with Output INVESTMENT, DEPRECIATION Y AND OUTPUT dk sY = = K K, CAPITAL,K
Step by Step Solution
There are 3 Steps involved in it
1 Expert Approved Answer
Step: 1 Unlock

Question Has Been Solved by an Expert!
Get step-by-step solutions from verified subject matter experts
Step: 2 Unlock
Step: 3 Unlock