Question: 2. Consider the time series given by {Y{ :t= -1,0,1,...,n} given by Y-1 = 1 Yo=1 Yt-2Ct Yt VE where {et : t = -1,0,1,...}
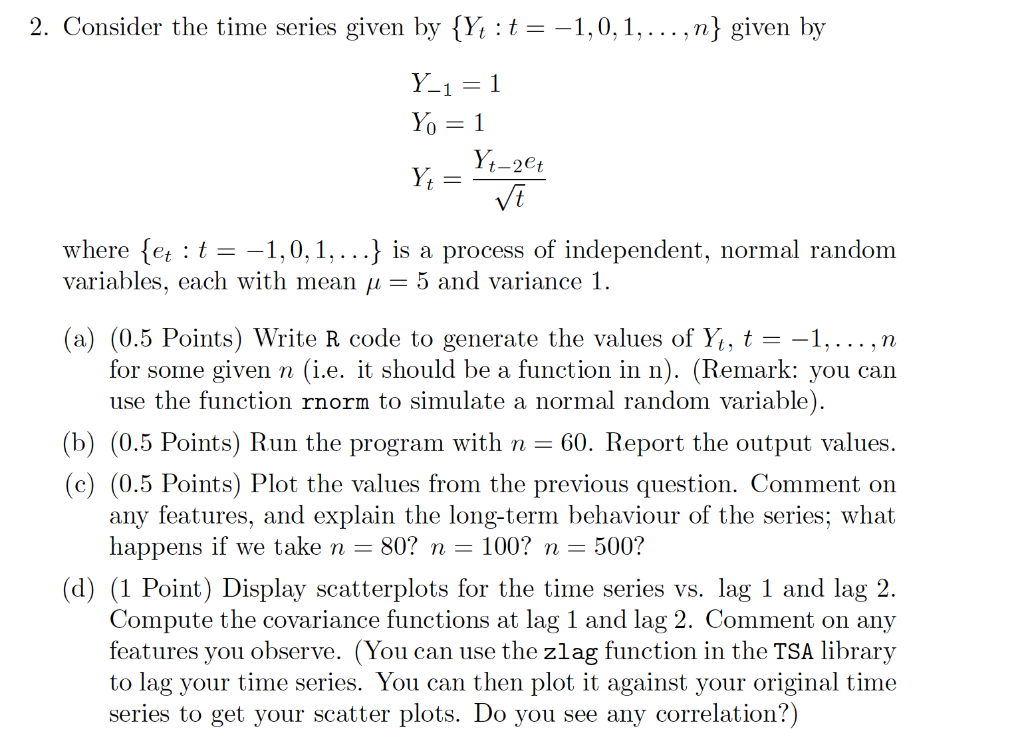
2. Consider the time series given by {Y{ :t= -1,0,1,...,n} given by Y-1 = 1 Yo=1 Yt-2Ct Yt VE where {et : t = -1,0,1,...} is a process of independent, normal random variables, each with mean u = 5 and variance 1. (a) (0.5 Points) Write R code to generate the values of Yt, t = -1,...,n for some given n (i.e. it should be a function in n). (Remark: you can use the function rnorm to simulate a normal random variable). (b) (0.5 Points) Run the program with n= 60. Report the output values. (C) (0.5 Points) Plot the values from the previous question. Comment on any features, and explain the long-term behaviour of the series; what happens if we take n = 80? n = 100? n = 500? (d) (1 Point) Display scatterplots for the time series vs. lag 1 and lag 2. Compute the covariance functions at lag 1 and lag 2. Comment on any features you observe. (You can use the zlag function in the TSA library to lag your time series. You can then plot it against your original time series to get your scatter plots. Do you see any correlation?) 2. Consider the time series given by {Y{ :t= -1,0,1,...,n} given by Y-1 = 1 Yo=1 Yt-2Ct Yt VE where {et : t = -1,0,1,...} is a process of independent, normal random variables, each with mean u = 5 and variance 1. (a) (0.5 Points) Write R code to generate the values of Yt, t = -1,...,n for some given n (i.e. it should be a function in n). (Remark: you can use the function rnorm to simulate a normal random variable). (b) (0.5 Points) Run the program with n= 60. Report the output values. (C) (0.5 Points) Plot the values from the previous question. Comment on any features, and explain the long-term behaviour of the series; what happens if we take n = 80? n = 100? n = 500? (d) (1 Point) Display scatterplots for the time series vs. lag 1 and lag 2. Compute the covariance functions at lag 1 and lag 2. Comment on any features you observe. (You can use the zlag function in the TSA library to lag your time series. You can then plot it against your original time series to get your scatter plots. Do you see any correlation?)


