

Question: 2. Consider the water-level data shown in the table for Lake Powell. 2000 2001 2002 Your supervisor has started a MATLAB script for you that
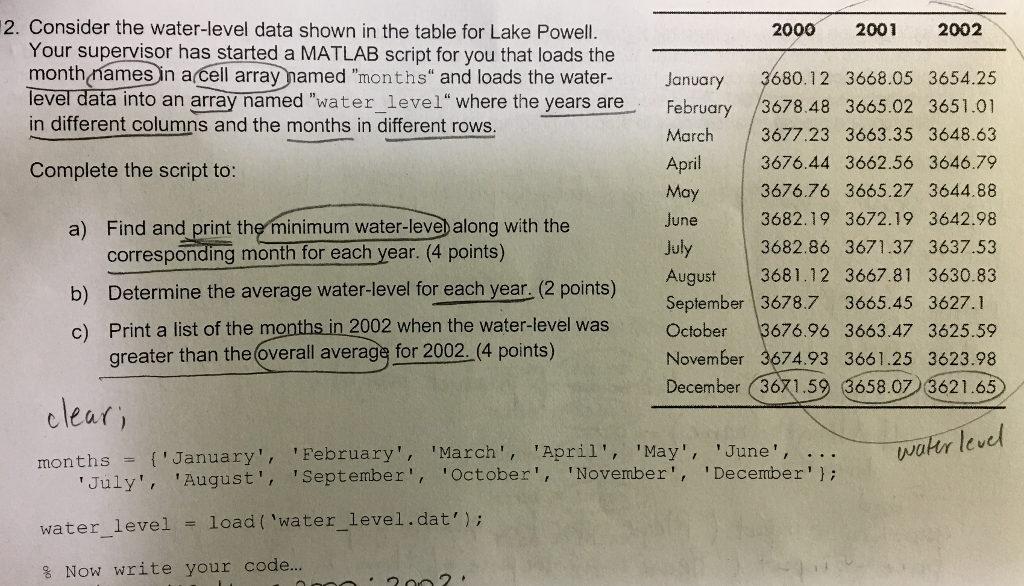
2. Consider the water-level data shown in the table for Lake Powell. 2000 2001 2002 Your supervisor has started a MATLAB script for you that loads the month names in a cell array named "months" and loads the water- January in different columns and the months in different rows Complete the script to 3680.12 3668.05 3654.225 level data into an array named "water_level"where the years are February 3678.48 3665.02 3651.01 March 3677.23 3663.35 3648.63 April 3676.44 3662.56 3646.79 3676.76 3665.27 3644.88 3682.19 3672.19 3642.98 July3682.86 3671.37 3637.53 August 3681.12 3667.81 3630.83 May June Find and print the minimum water-leveb along with the corresponding month for each year. (4 points) a) b) Determine the average water-level for each year. (2 points)Sepmber 3678.7 3665.45 3627. c) Print a list of the months in 2002 when the water-level was October 3676.96 3663.47 3625.59 November 3674.93 3661.25 3623.98 December 3671.59 658.07 3621.65 greater than the (overall average for 2002. (4 points) cleut wakr level months= {'January', 'February ' , 'March', 'April', 'May , , ,June , , 'August', 'September', October', 'November', 'December'); water. I evel load ('water-level . dat'); = % Now write your code.. On
Step by Step Solution
There are 3 Steps involved in it

Get step-by-step solutions from verified subject matter experts