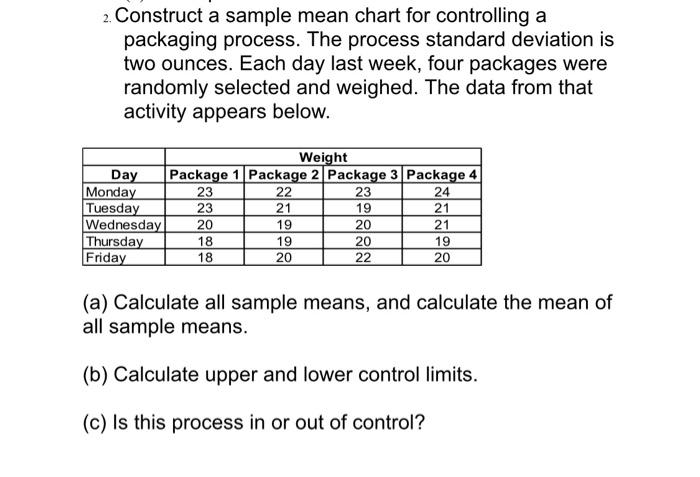
Question: 2. Construct a sample mean chart for controlling a packaging process. The process standard deviation is two ounces. Each day last week, four packages were

2. Construct a sample mean chart for controlling
2. Construct a sample mean chart for controlling a packaging process. The process standard deviation is two ounces. Each day last week, four packages were randomly selected and weighed. The data from that activity appears below. Weight Day Package 1 Package 2 Package 3 Package 4 Monday 23 22 23 24 Tuesday 23 21 19 21 Wednesday 20 19 20 21 Thursday 18 19 20 19 Friday 18 20 22 20 (a) Calculate all sample means, and calculate the mean of all sample means. (b) Calculate upper and lower control limits. (c) Is this process in or out of control

Step by Step Solution

There are 3 Steps involved in it

1 Expert Approved Answer
Step: 1 Unlock blur-text-image
Question Has Been Solved by an Expert!

Get step-by-step solutions from verified subject matter experts

Step: 2 Unlock
Step: 3 Unlock

Students Have Also Explored These Related General Management Questions!