

Question: 2. Construct an x chart. Answer the questions associated with each given data set. Control Chart Constants S x R n A2 A3 B3
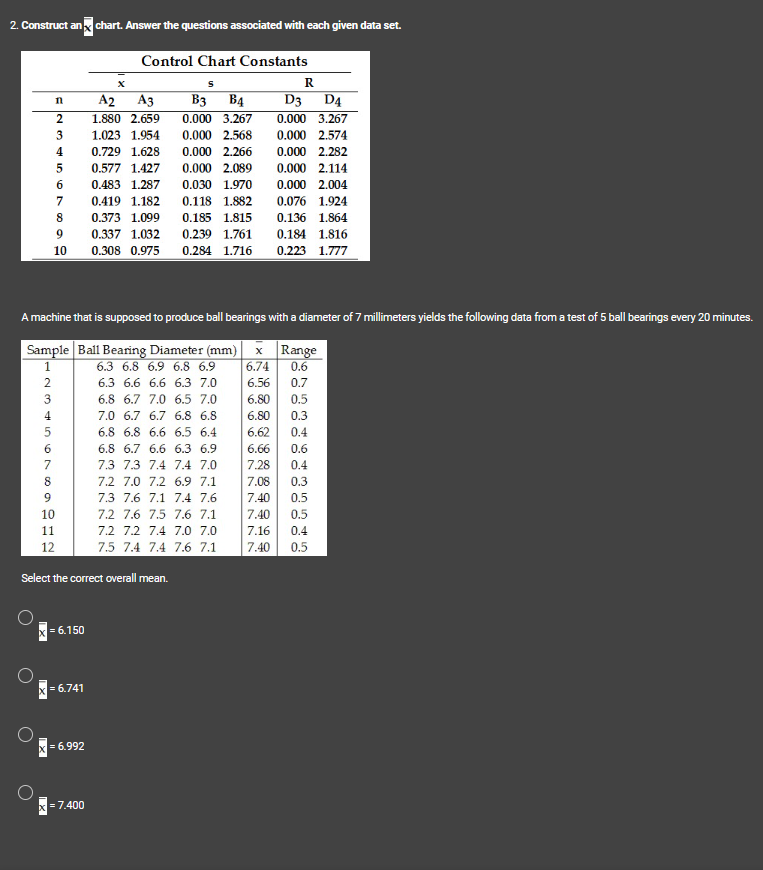
2. Construct an x chart. Answer the questions associated with each given data set. Control Chart Constants S x R n A2 A3 B3 B4 D3 2 1.880 2.659 0.000 3.267 0.000 3.267 3 1.023 1.954 0.000 2.568 0.000 2.574 4 0.729 1.628 0.000 2.266 5 0.577 1.427 0.000 2.089 67 6 0.483 1.287 0.030 1.970 0.000 2.282 0.000 2.114 0.000 2.004 0.419 1.182 0.118 1.882 0.076 1.924 8 0.373 1.099 0.185 1.815 0.136 1.864 9 0.337 1.032 0.239 1.761 0.184 1.816 10 0.308 0.975 0.284 1.716 0.223 1.777 A machine that is supposed to produce ball bearings with a diameter of 7 millimeters yields the following data from a test of 5 ball bearings every 20 minutes. Sample Ball Bearing Diameter (mm) x Range 1 23 6.3 6.8 6.9 6.8 6.9 6.3 6.6 6.6 6.3 7.0 6.8 6.7 7.0 6.5 7.0 6.74 0.6 6.56 0.7 6.80 0.5 456760 4 7.0 6.7 6.7 6.8 6.8 6.8 6.8 6.6 6.5 6.4 6.8 6.7 6.6 6.3 6.9 7.3 7.3 7.4 7.4 7.0 6.80 0.3 6.62 0.4 8 7.2 7.0 7.2 6.9 7.1 6.66 0.6 7.28 0.4 7.08 0.3 9 7.3 7.6 7.1 7.4 7.6 7.40 0.5 10 7.2 7.6 7.5 7.6 7.1 7.40 0.5 11 7.2 7.2 7.4 7.0 7.0 7.16 0.4 12 7.5 7.4 7.4 7.6 7.1 7.40 0.5 Select the correct overall mean. = 6.150 = 6.741 = 6.992 = 7.400
Step by Step Solution
There are 3 Steps involved in it

Get step-by-step solutions from verified subject matter experts