Question: 2. Create a form as shown below: Haze Indicator Application This application will assess the haze severity for Perak, Malaysia Please enter the API Safety
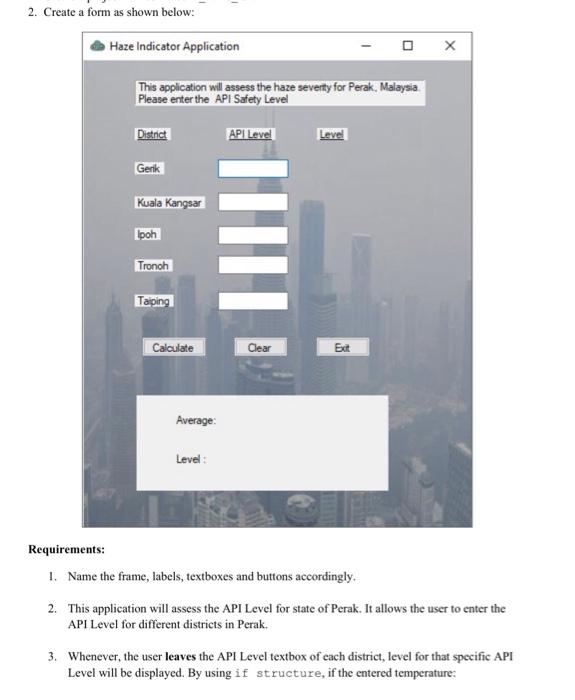
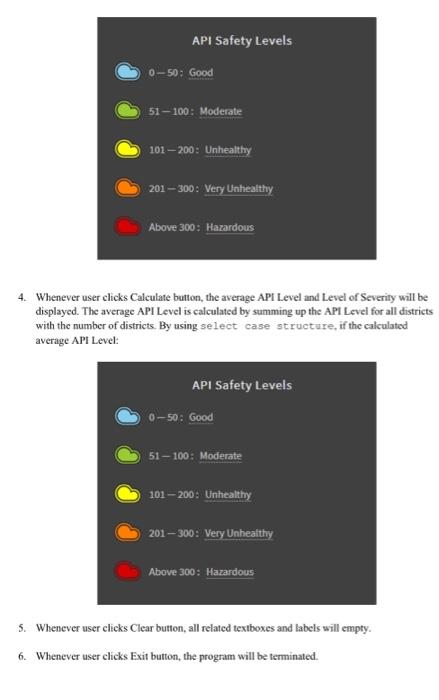
2. Create a form as shown below: Haze Indicator Application This application will assess the haze severity for Perak, Malaysia Please enter the API Safety Level District API Level Genk Kuala Kangsar Ipoh Tronoh Taiping Calculate Clear Excit Average: Level: Requirements: 1. Name the frame, labels, textboxes and buttons accordingly. 2. This application will assess the API Level for state of Perak. It allows the user to enter the API Level for different districts in Perak. 3. Whenever, the user leaves the API Level textbox of each district, level for that specific API Level will be displayed. By using if structure, if the entered temperature: API Safety Levels 0-50: Good 51-100: Moderate 101 - 200: Unhealthy 201-300: Very Unhealthy Above 300: Hazardous 4. Whenever user clicks Calculate button, the average API Level and Level of Severity will be displayed. The average API Level is calculated by summing up the API Level for all districts with the number of districts. By using select case structure, if the calculated average API Level: API Safety Levels 0-50: Good 51 - 100: Moderate 101 - 200: Unhealthy 201-300: Very Unhealthy Above 300: Hazardous 5. Whenever user clicks Clear button, all related textboxes and labels will empty 6. Whenever user clicks Exit button, the program will be terminated. 2. Create a form as shown below: Haze Indicator Application This application will assess the haze severity for Perak, Malaysia Please enter the API Safety Level District API Level Genk Kuala Kangsar Ipoh Tronoh Taiping Calculate Clear Excit Average: Level: Requirements: 1. Name the frame, labels, textboxes and buttons accordingly. 2. This application will assess the API Level for state of Perak. It allows the user to enter the API Level for different districts in Perak. 3. Whenever, the user leaves the API Level textbox of each district, level for that specific API Level will be displayed. By using if structure, if the entered temperature: API Safety Levels 0-50: Good 51-100: Moderate 101 - 200: Unhealthy 201-300: Very Unhealthy Above 300: Hazardous 4. Whenever user clicks Calculate button, the average API Level and Level of Severity will be displayed. The average API Level is calculated by summing up the API Level for all districts with the number of districts. By using select case structure, if the calculated average API Level: API Safety Levels 0-50: Good 51 - 100: Moderate 101 - 200: Unhealthy 201-300: Very Unhealthy Above 300: Hazardous 5. Whenever user clicks Clear button, all related textboxes and labels will empty 6. Whenever user clicks Exit button, the program will be terminated