

Question: 2. Create a scatterplot. Carefully label and scale the axes. Describe the direction and strength. Foot length 14 Test Score 56 67 15 16
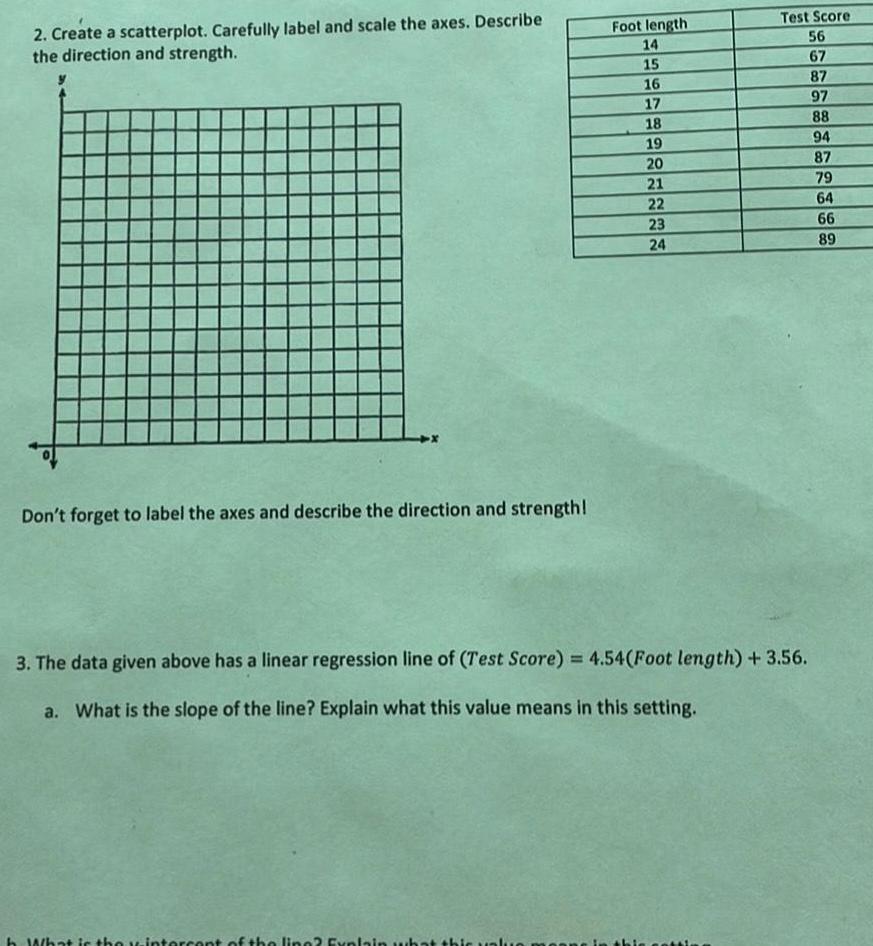
2. Create a scatterplot. Carefully label and scale the axes. Describe the direction and strength. Foot length 14 Test Score 56 67 15 16 87 97 17 88 18 19 94 20 87 21 79 22 64 23 66 24 89 Don't forget to label the axes and describe the direction and strength! 3. The data given above has a linear regression line of (Test Score) = 4.54(Foot length) + 3.56. a. What is the slope of the line? Explain what this value means in this setting. b. Whi interce
Step by Step Solution
There are 3 Steps involved in it
1 Expert Approved Answer
Step: 1 Unlock

Question Has Been Solved by an Expert!
Get step-by-step solutions from verified subject matter experts
Step: 2 Unlock
Step: 3 Unlock