

Question: 2. Create a set of scatter charts by plotting each of the rows in Exhibit 13 against the development cost row. For each one, explain
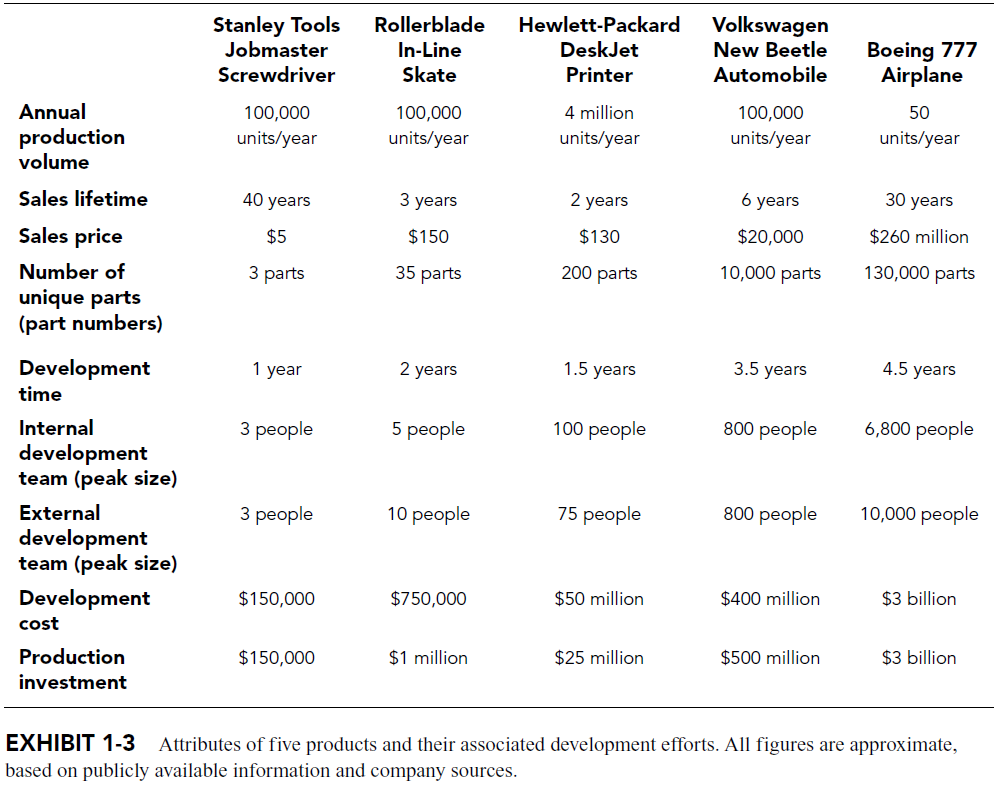
2. Create a set of scatter charts by plotting each of the rows in Exhibit 13 against the development cost row. For each one, explain why there is or is not any correlation. (For example, you would first plot "annual production volume" versus "development cost" and explain why there seems to be no correlation. Then repeat for each of the remaining rows.) EXHIBIT 1-3 Attributes of five products and their associated development efforts. All figures are approximate, based on publicly available information and company sources
Step by Step Solution
There are 3 Steps involved in it
1 Expert Approved Answer
Step: 1 Unlock

Question Has Been Solved by an Expert!
Get step-by-step solutions from verified subject matter experts
Step: 2 Unlock
Step: 3 Unlock