

Question: 2. Create two appropriate diagrams to compare variables, either solely in Undergraduate or Graduate Category or compare between both categories. Hint: Think carefully about which

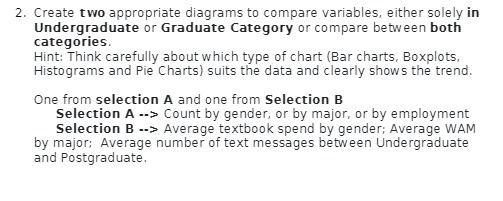
2. Create two appropriate diagrams to compare variables, either solely in Undergraduate or Graduate Category or compare between both categories. Hint: Think carefully about which type of chart (Bar charts, Boxplots, Histograms and Pie Charts) suits the data and clearly shows the trend. One from selection A and one from Selection B Selection A --> Count by gender, or by major, or by employment Selection B --> Average textbook spend by gender; Average WAM by major; Average number of text messages between Undergraduate and Postgraduate
Step by Step Solution
There are 3 Steps involved in it
1 Expert Approved Answer
Step: 1 Unlock

Question Has Been Solved by an Expert!
Get step-by-step solutions from verified subject matter experts
Step: 2 Unlock
Step: 3 Unlock