

Question: 2. Demand for a product is given in the table below: (a) Using the Microsoft Excel, plot the quarterly demand in years 2019, 2020 and
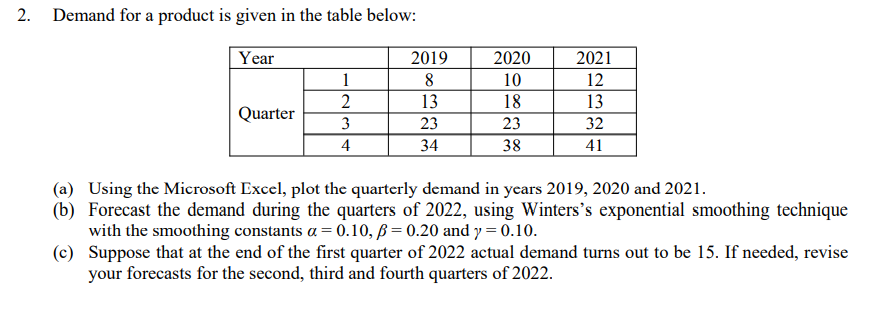
2. Demand for a product is given in the table below: (a) Using the Microsoft Excel, plot the quarterly demand in years 2019, 2020 and 2021. (b) Forecast the demand during the quarters of 2022, using Winters's exponential smoothing technique with the smoothing constants =0.10,=0.20 and =0.10. (c) Suppose that at the end of the first quarter of 2022 actual demand turns out to be 15 . If needed, revise your forecasts for the second, third and fourth quarters of 2022. 2. Demand for a product is given in the table below: (a) Using the Microsoft Excel, plot the quarterly demand in years 2019, 2020 and 2021. (b) Forecast the demand during the quarters of 2022, using Winters's exponential smoothing technique with the smoothing constants =0.10,=0.20 and =0.10. (c) Suppose that at the end of the first quarter of 2022 actual demand turns out to be 15 . If needed, revise your forecasts for the second, third and fourth quarters of 2022
Step by Step Solution
There are 3 Steps involved in it

Get step-by-step solutions from verified subject matter experts