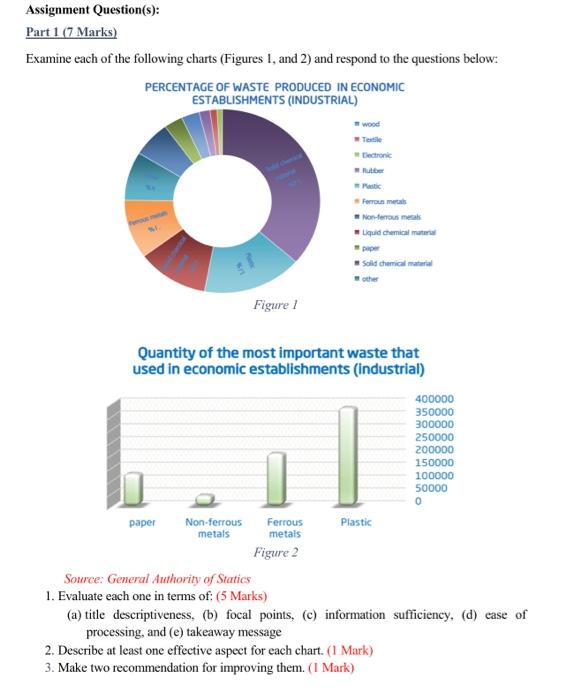
Question: 2. Describe at least one effective aspect for each chart. (1 Mark) Assignment Question(s): Part 1 (7 Marks) Examine each of the following charts (Figures

2. Describe at least one effective aspect for each chart. (1 Mark)

2. Describe at least one effective aspect for
Assignment Question(s): Part 1 (7 Marks) Examine each of the following charts (Figures 1, and 2) and respond to the questions below: PERCENTAGE OF WASTE PRODUCED IN ECONOMIC ESTABLISHMENTS (INDUSTRIAL) M wood = Teasile - Tectronic - Nutber =7 Ravic A Ferroun merath - Nom-terous merak - Lquid chemical matienul th piper - Solid chemical material E ceher Quantity of the most important waste that used in economic establishments (industrial) Source: General Authority of Statics 1. Evaluate each one in terms of: (5 Marks) (a) title descriptiveness, (b) focal points, (c) information sufficiency, (d) ease of processing, and (e) takeaway message 2. Describe at least one effective aspect for each chart. ( 1 Mark) 3. Make two recommendation for improving them. (I Mark)

Step by Step Solution

There are 3 Steps involved in it

1 Expert Approved Answer
Step: 1 Unlock blur-text-image
Question Has Been Solved by an Expert!

Get step-by-step solutions from verified subject matter experts

Step: 2 Unlock
Step: 3 Unlock

Students Have Also Explored These Related General Management Questions!