

Question: 2 . Develop a flowchart that accepts as input three, in - class test scores and a project score for ten students which will represent
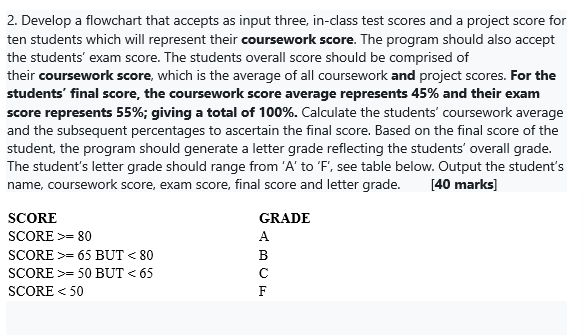
Develop a flowchart that accepts as input three, inclass test scores and a project score for ten students which will represent their coursework score. The program should also accept the students' exam score. The students overall score should be comprised of their coursework score, which is the average of all coursework and project scores. For the students' final score, the coursework score average represents and their exam score represents ; giving a total of mathbf Calculate the students' coursework average and the subsequent percentages to ascertain the final score. Based on the final score of the student, the program should generate a letter grade reflecting the students' overall grade. The student's letter grade should range from A to F see table below. Output the student's name, coursework score, exam score, final score and letter grade.
marks
Step by Step Solution
There are 3 Steps involved in it
1 Expert Approved Answer
Step: 1 Unlock

Question Has Been Solved by an Expert!
Get step-by-step solutions from verified subject matter experts
Step: 2 Unlock
Step: 3 Unlock