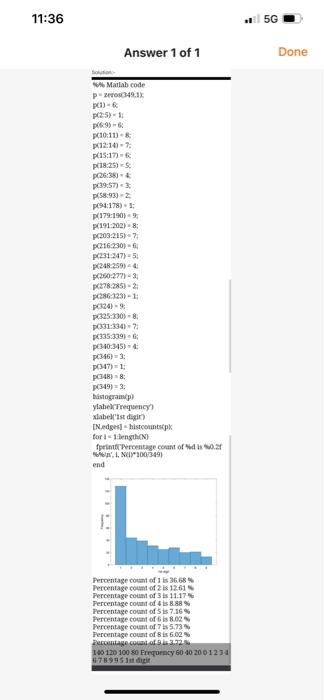
Question: 2. Draw a bar graph (using percentages) for the simple frequency distribution of the first digits of Massachusetts city and town populations from the prior

2. Draw a bar graph (using percentages) for the
2. Draw a bar graph (using percentages) for the simple frequency distribution of the first digits of Massachusetts city and town populations from the prior module. Why is a bar graph used instead of a histogram? What can you say about the shape of the distribution? Look up Benford's Law, and explain the pattern shown in the distribution of populations. 3. Draw a histogram (using percentages) for the grouped frequency distribution of daily high temperatures for City X from the prior module. Why is a histogram used instead of a bar graph? What can you say about the shape of the distribution? 11:36 5G Answer 1 of 1 Done A Matlab code P349.1% (1) (25) 11 10:11)-8 (12:10 - 7 p(15:17) p(18:255 26:38 p(3957) p(58:93) p(946:178) 1: p(179:190 (191202) 8 PC203:215) (216:230) P231 247) 5 (248-2594 250:277) - 3: (278-285) - 2 PC86:823)-1: p024 p0325 330) 0331:34) p340:345) 0346) = 3: P0347)=1 p(34) p05493: histograp) yabelFrequency label ist digit INedgeshistcounts for length print Percentage count of d. I NIY100349) end Percentage count of 1668 Percentage count of 2 is 1261 Percentage count of 3 11.17 Percentage of 4 is 88 Percentagecoat ofis 7.169 Percentage count of 68.02 Percentage count of 75.73 Percentage count of is 6.02% Percentage.com 100 120 100 80 Frequency 60 40 20 01234 789951

Step by Step Solution

There are 3 Steps involved in it

1 Expert Approved Answer
Step: 1 Unlock blur-text-image
Question Has Been Solved by an Expert!

Get step-by-step solutions from verified subject matter experts

Step: 2 Unlock
Step: 3 Unlock

Students Have Also Explored These Related General Management Questions!