

Question: 2. Draw a pie chart and bar graph to display the data. The data represent the number of Nobel Prize laureates. by country during the
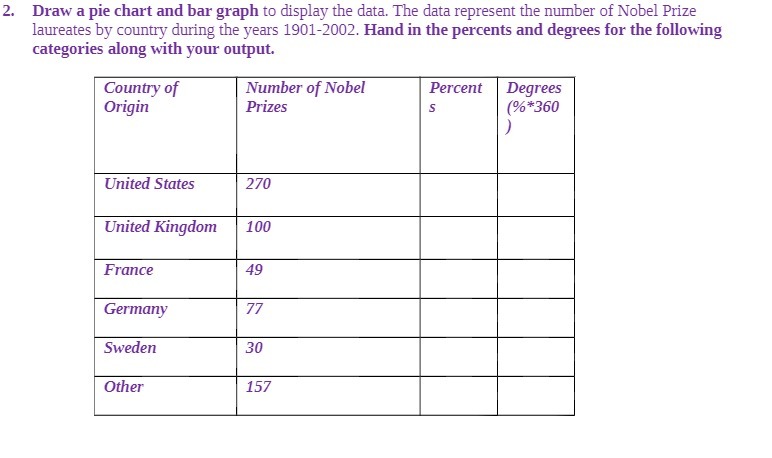
2. Draw a pie chart and bar graph to display the data. The data represent the number of Nobel Prize laureates. by country during the years lQDlEDUE. Hand in the percents and degrees for the following categories along with your output. Number of Nobel Percent Degrees Prizes s (9% *360 J United States United Kingdom Germany Sweden Other
Step by Step Solution
There are 3 Steps involved in it
1 Expert Approved Answer
Step: 1 Unlock

Question Has Been Solved by an Expert!
Get step-by-step solutions from verified subject matter experts
Step: 2 Unlock
Step: 3 Unlock