

Question: 2. Draw a scatterplot for the following data and then calculate Pearson's r. What does r suggest about the direction and strength of the association
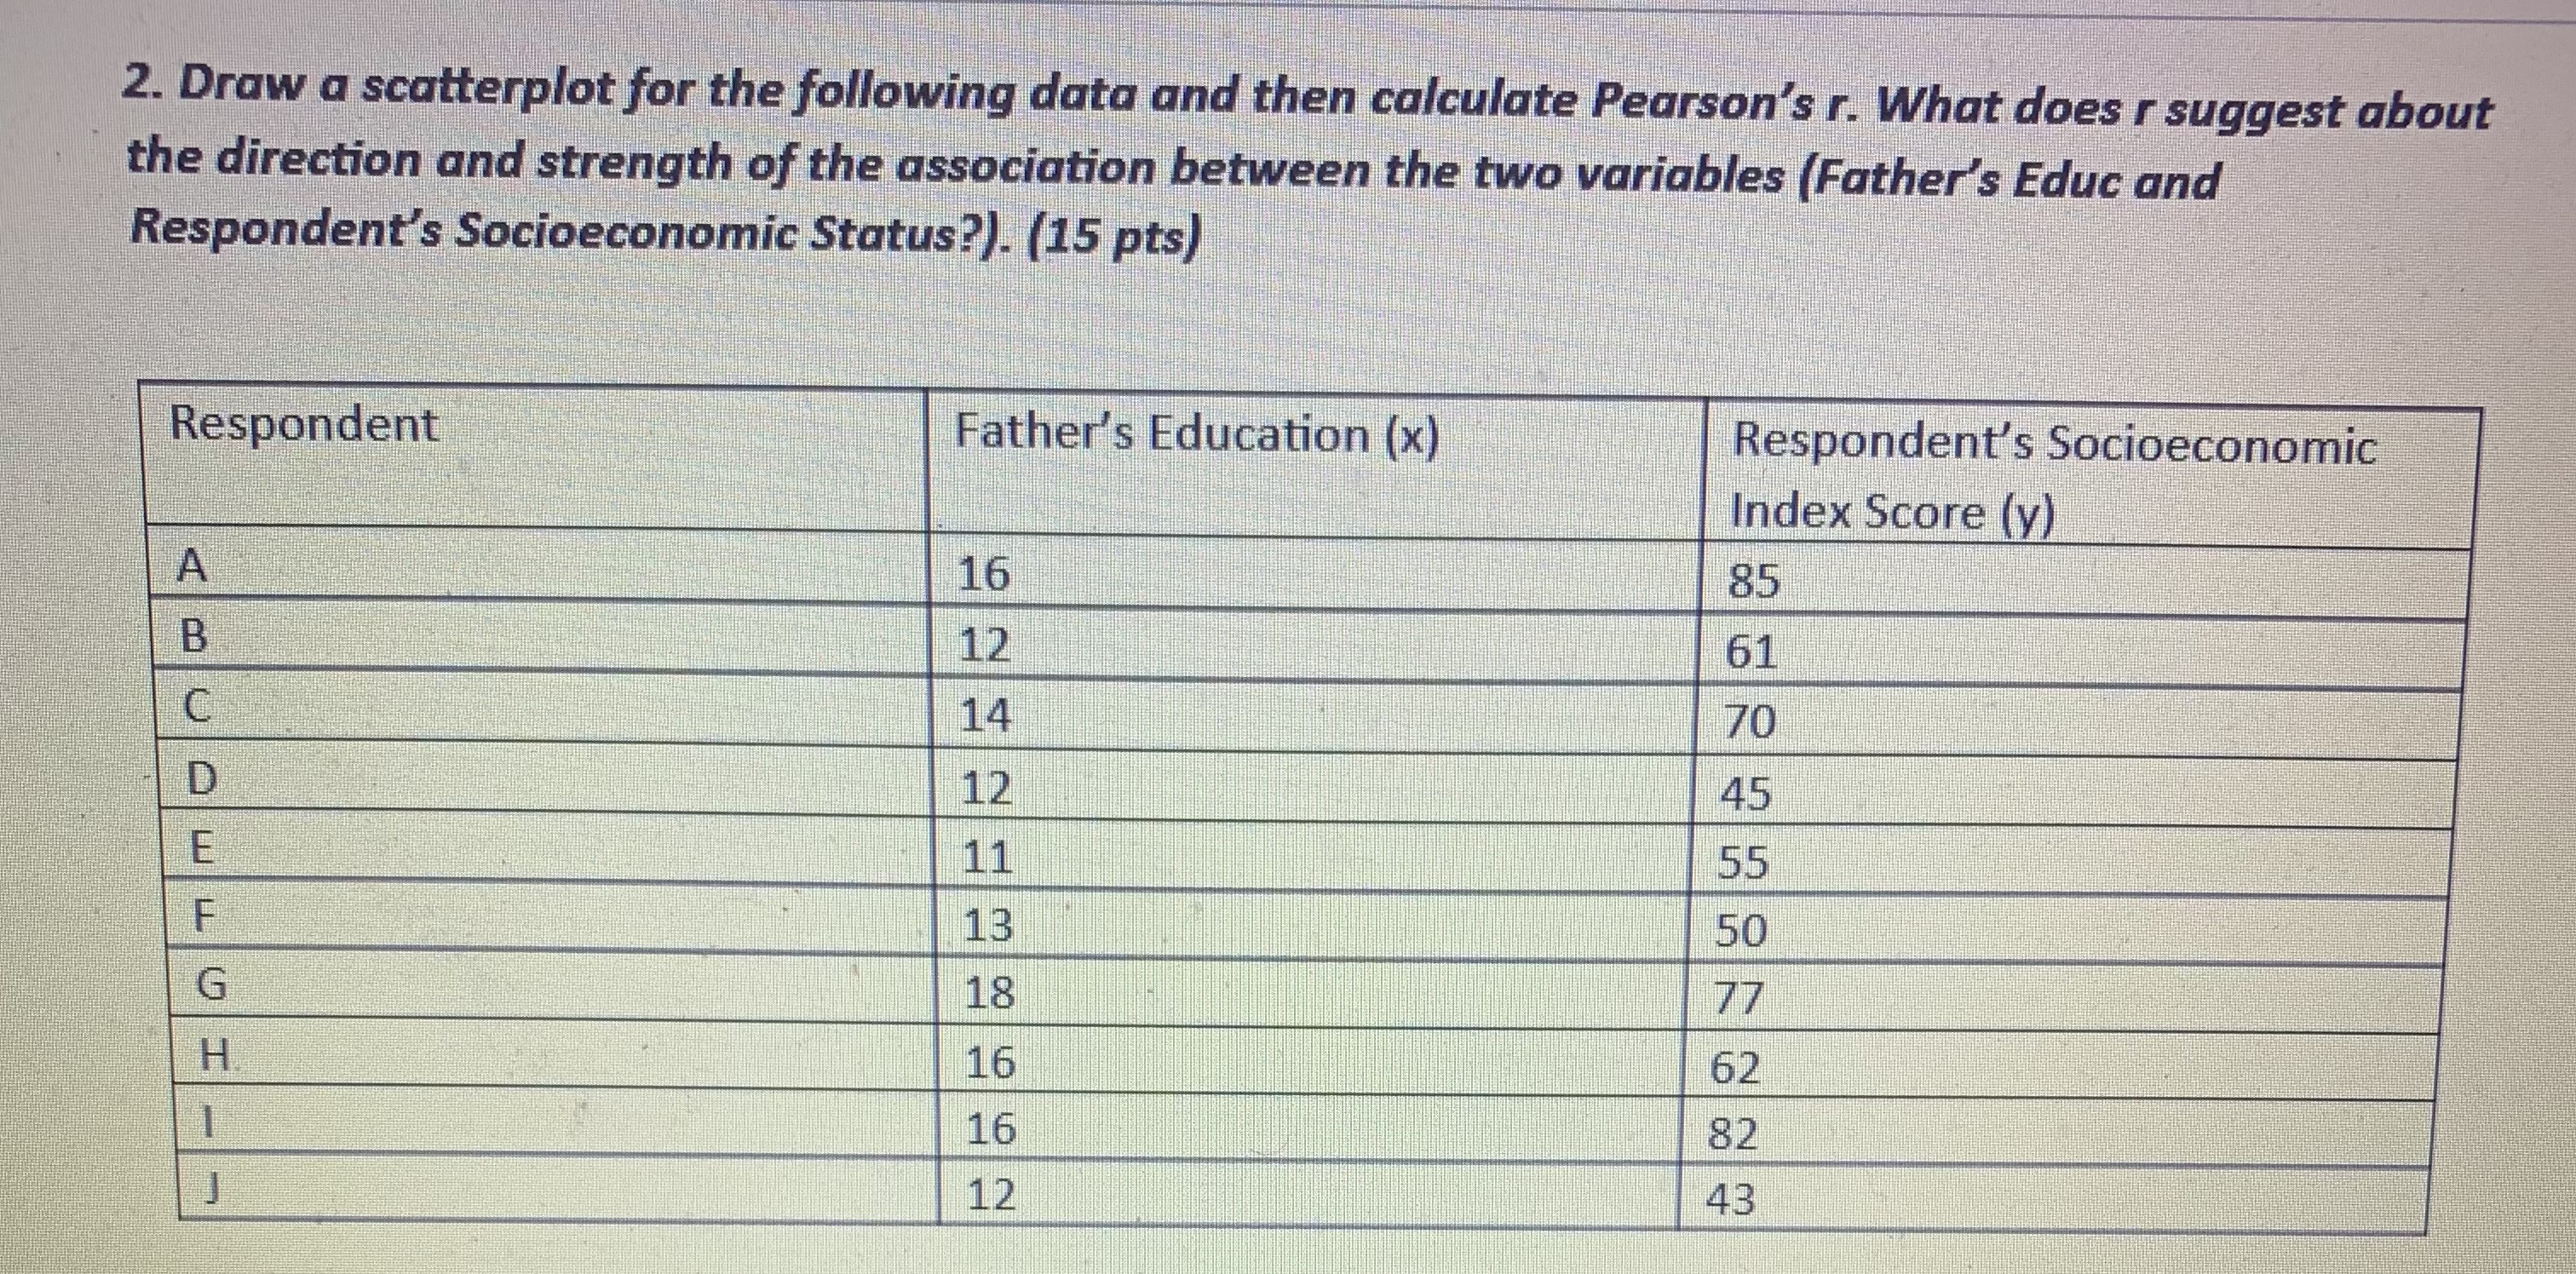
2. Draw a scatterplot for the following data and then calculate Pearson's r. What does r suggest about the direction and strength of the association between the two variables (Father's Educ and Respondent's Socioeconomic Status?). (15 pts) Respondent Father's Education (x) Respondent's Socioeconomic Index Score (y) A 16 85 B 12 61 C 14 70 D 12 45 E 11 55 F 13 50 G 18 77 H 16 62 16 82 12 43
Step by Step Solution
There are 3 Steps involved in it
1 Expert Approved Answer
Step: 1 Unlock

Question Has Been Solved by an Expert!
Get step-by-step solutions from verified subject matter experts
Step: 2 Unlock
Step: 3 Unlock