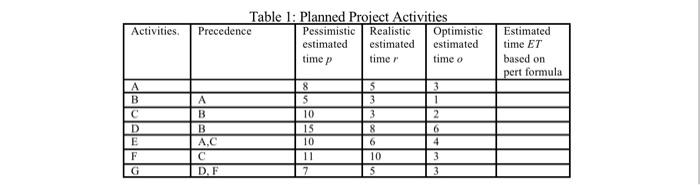
Question: 2. Draw the network diagram based on the above table and find out the critical path using the PERT analysis based estimated time in question

2. Draw the network diagram based on the above
2. Draw the network diagram based on the above table and find out the critical path using the PERT analysis based estimated time in question 1. Show all your steps clearly, (20 marks) 4 marks for activity network diagram, 14 marks for related calculation of ES, EF, LS and LF, 2 marks for mentioning slack time for each activity and identification of correct critical path Total =20 Marks ) Table 1: Planned Project Activities \begin{tabular}{|l|l|l|l|l|l|} \hline Activities. & Precedence & Pessimistic estimated time p & Realistic estimated time r & Optimistic estimated time o & Estimated time ET based on pert formula \\ \hline A & & 8 & 5 & 3 & \\ \hline B & A & 5 & 3 & 1 & \\ \hline C & B & 10 & 3 & 2 & \\ \hline D & B & 15 & 8 & 6 & \\ \hline E & A,C & 10 & 6 & 4 & \\ \hline F & C & 11 & 10 & 3 & \\ \hline G & D, F & 7 & 5 & 3 & \\ \hline \end{tabular}

Step by Step Solution

There are 3 Steps involved in it

1 Expert Approved Answer
Step: 1 Unlock blur-text-image
Question Has Been Solved by an Expert!

Get step-by-step solutions from verified subject matter experts

Step: 2 Unlock
Step: 3 Unlock

Students Have Also Explored These Related General Management Questions!