

Question: 2. Explain how the following concepts or principles have been applied to the B-C analysis conducted in the worksheet (you need to explain the following
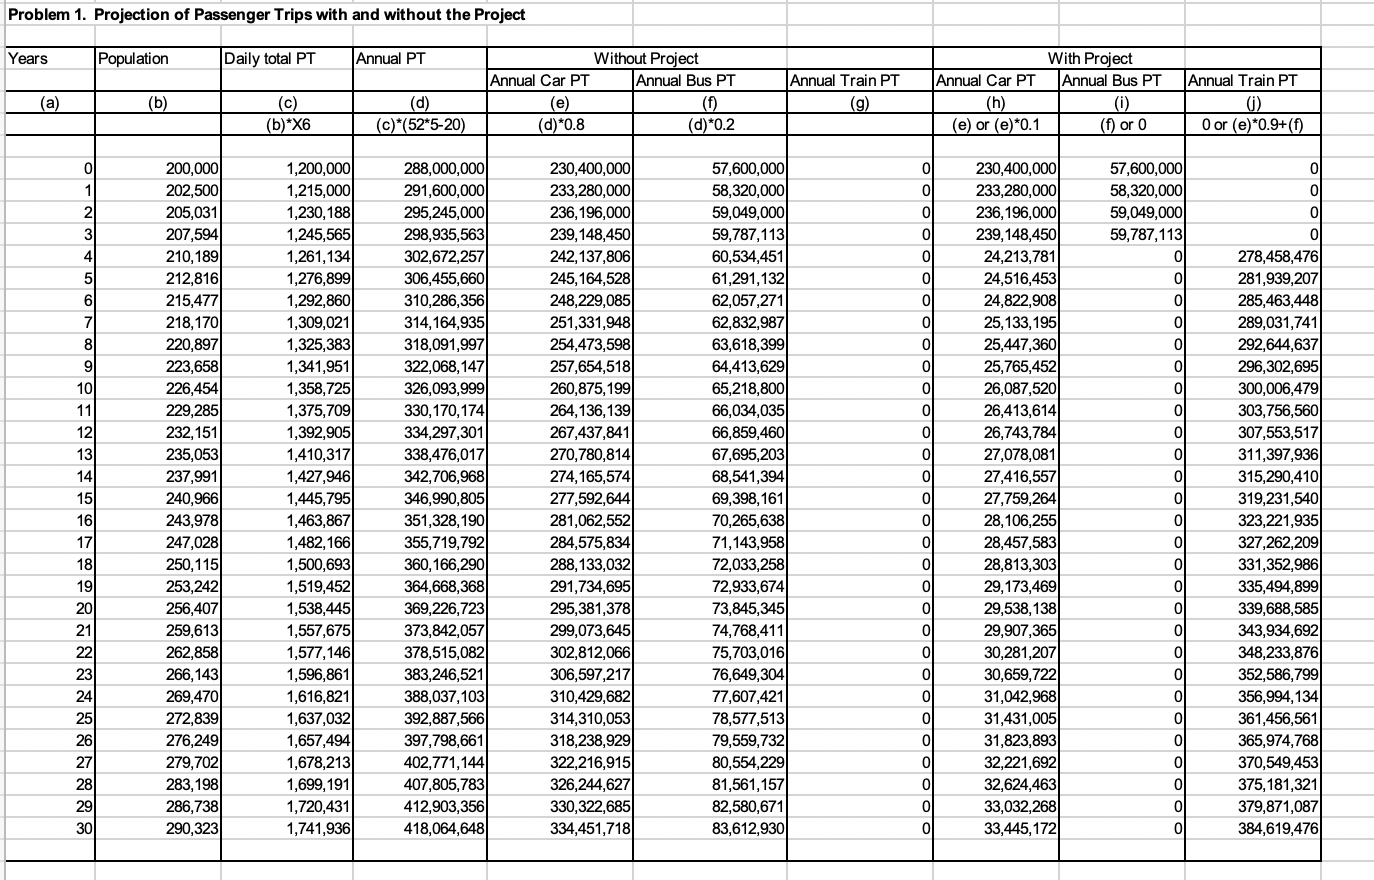
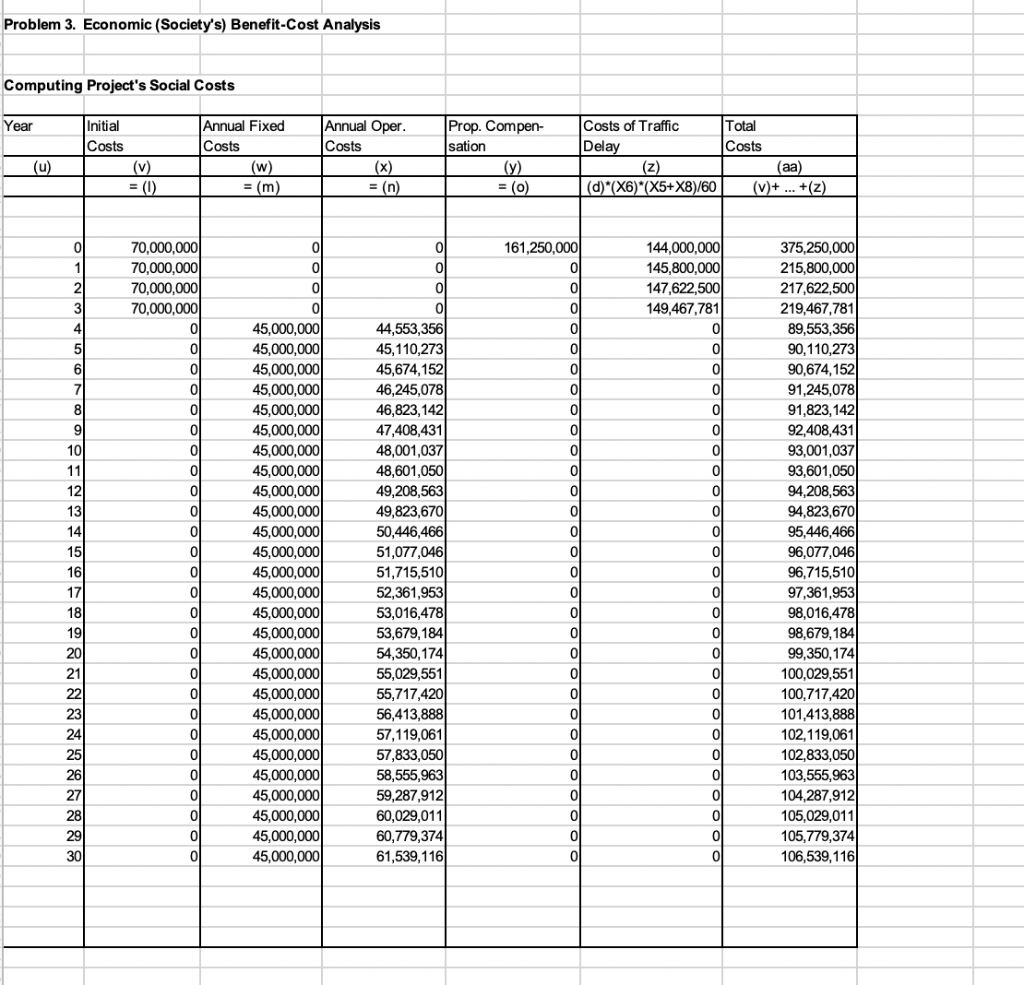
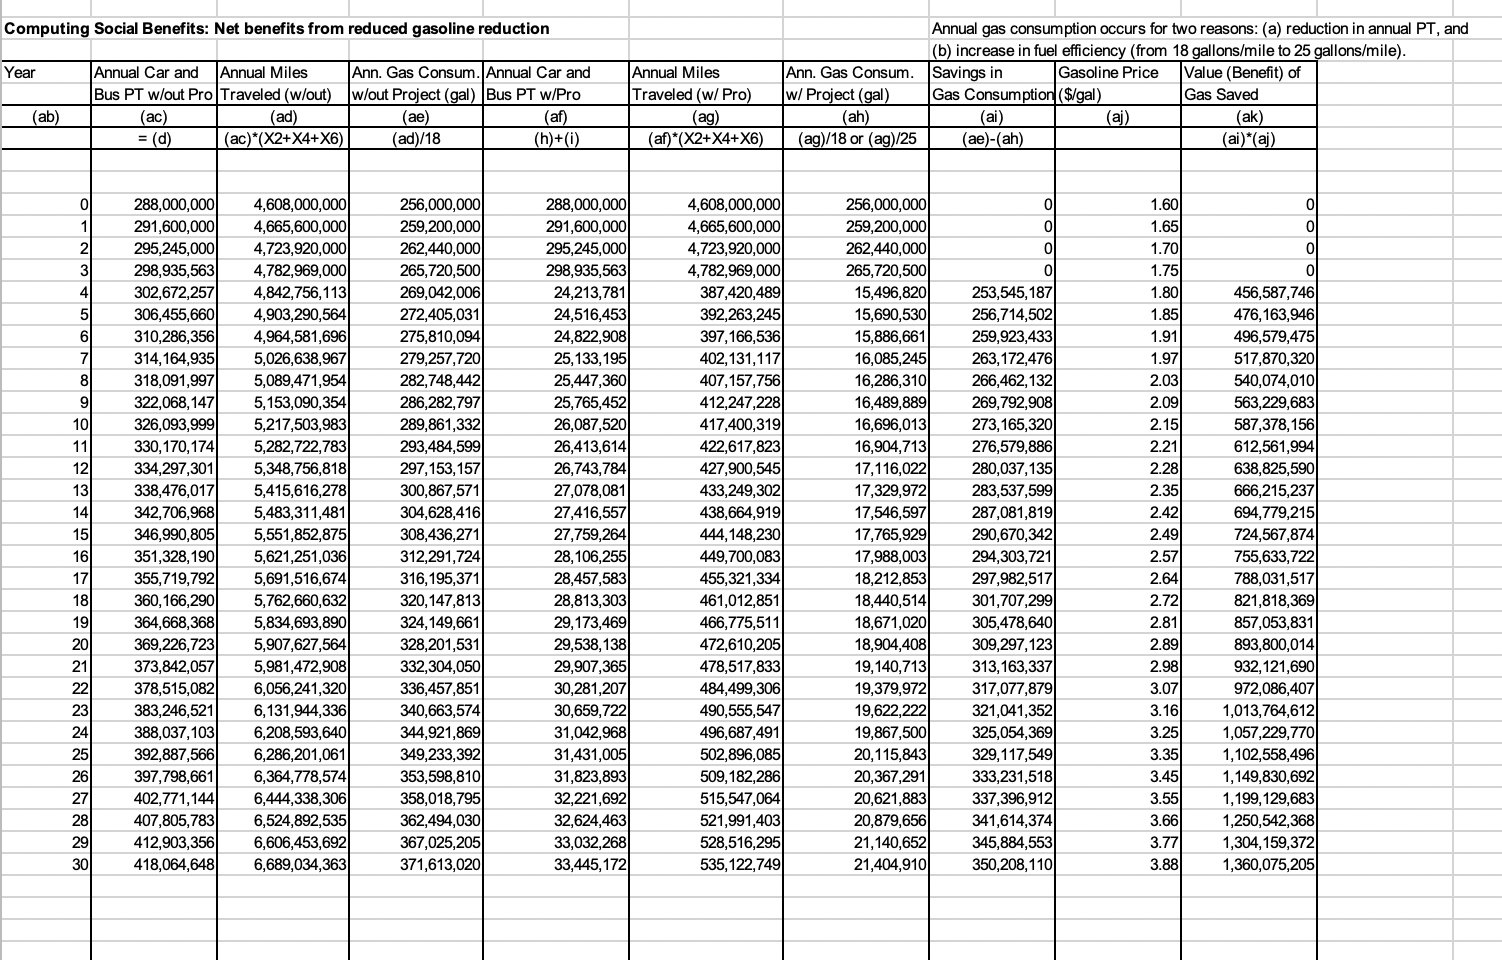
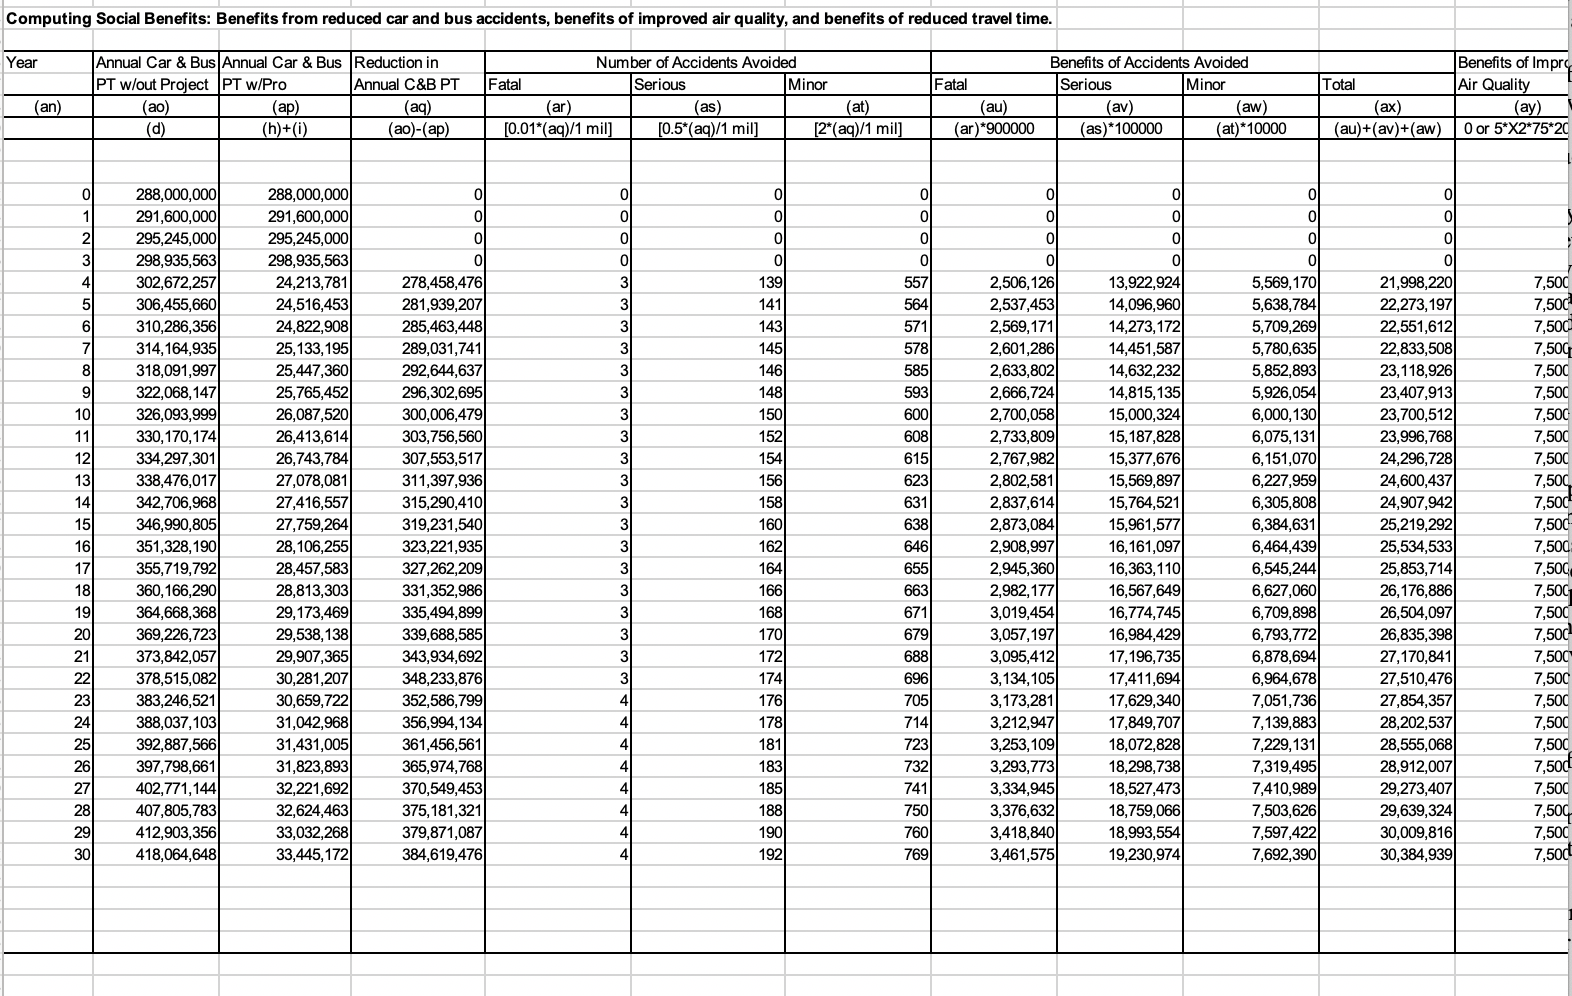
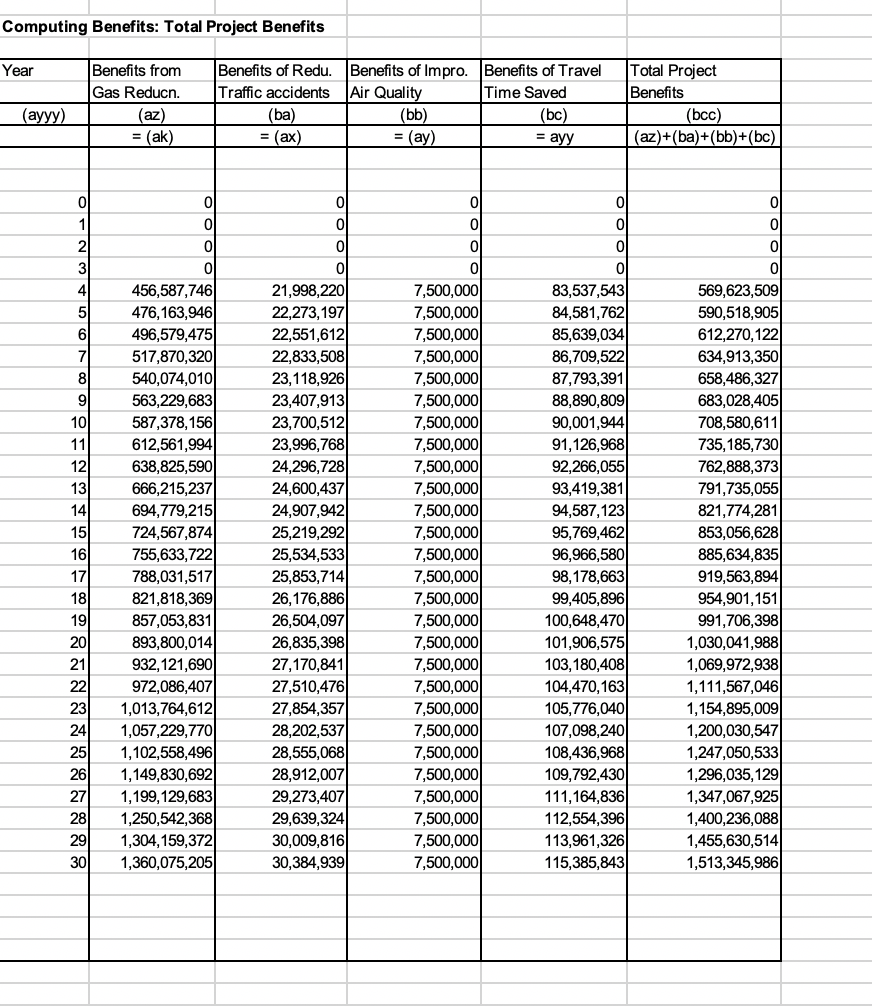
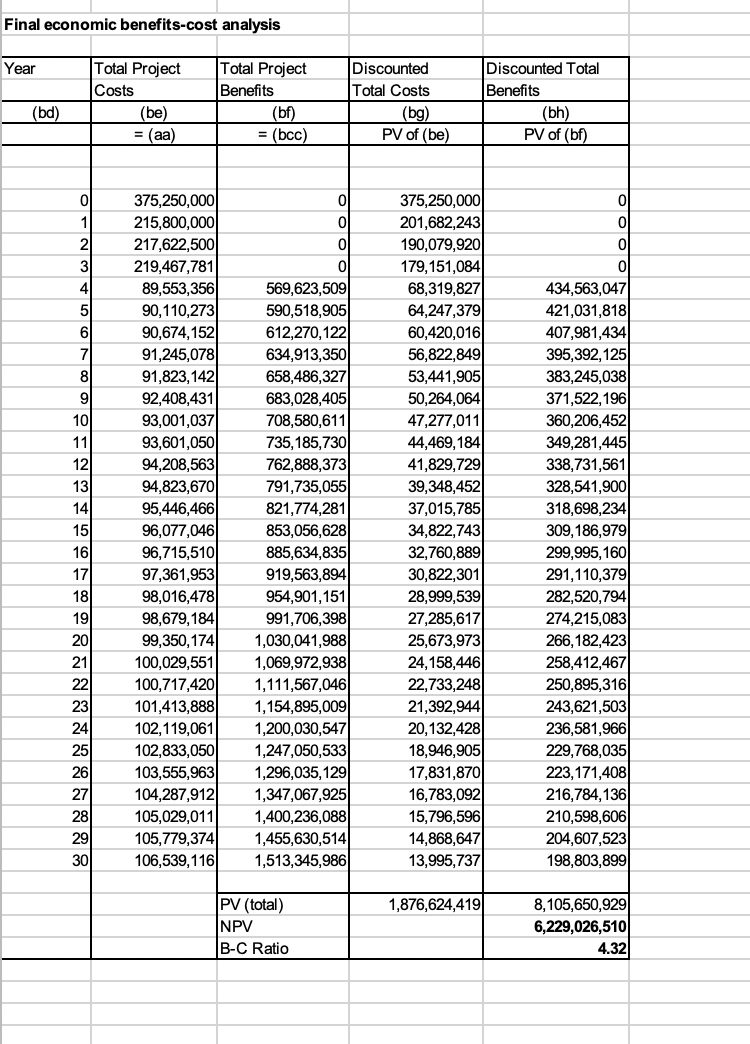
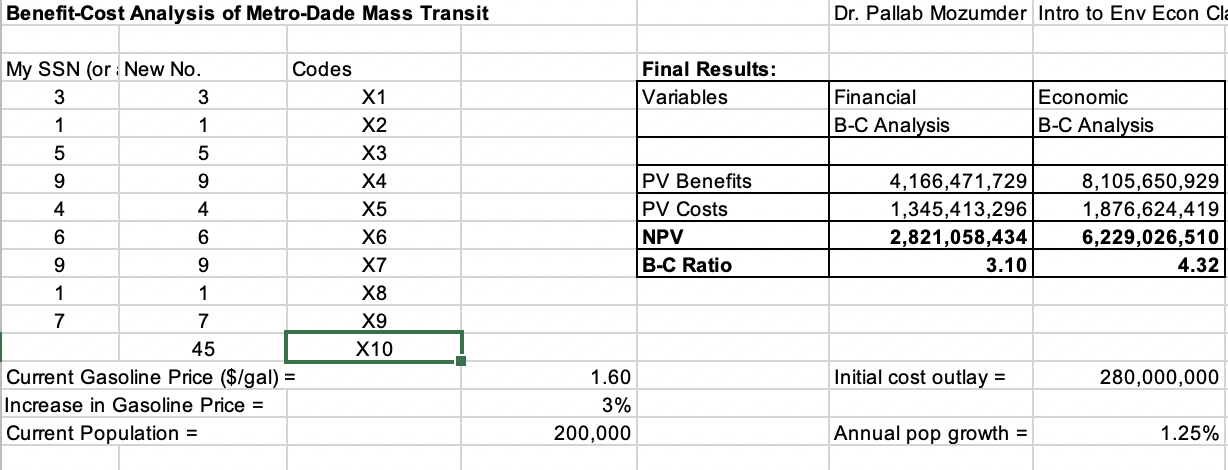
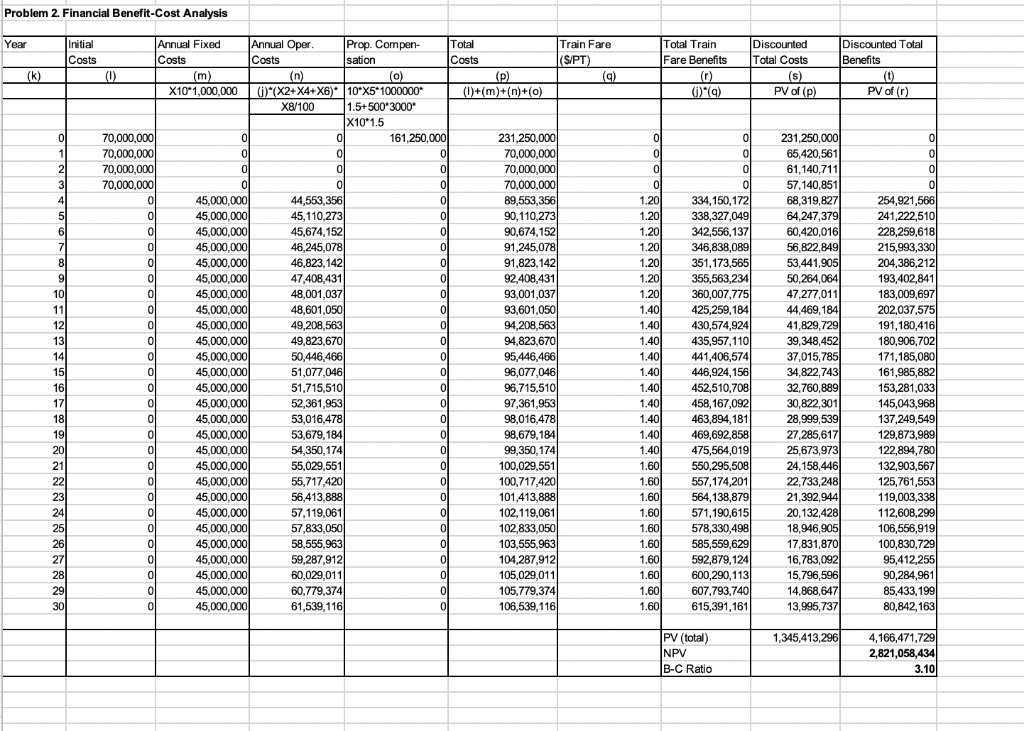
2. Explain how the following concepts or principles have been applied to the B-C analysis conducted in the worksheet (you need to explain the following concepts in terms of actual numbers that you get from your worksheet. Hint: reading chapter 8, 9 & 10 might help in answering this question). a. Opportunity cost principle b. Non-market benefits c. With and without principle d. Operation and maintenance costs e. Public goods f. Damage compensation 3. Compute Internal Rate of Returns for the project (financial and socio-economic), using the worksheet. 4. Present (using appropriate tables) the main results of your analysis: total (30 years) discounted and undiscounted benefits and costs, net present values, B-C ratios and IRRs for both analyses. Based on these results, make recommendations to the MDTA Director as to whether the project is financially and economically viable or not, with justification. Your justification should point to some of the economic principles that we discussed in this course. Also, the recommendation must indicate important project indicators such as benefit-cost ratio, net present values, and internal rate of return. Make sure to explain why you conducted the three types of analyses, what the differences are, etc. 5. Discuss any two funding mechanisms for raising money for this project. Problem 1. Projection of Passenger Trips with and without the Project Years Population Daily total PT Annual PT Without Project Annual Car PT Annual Bus PT (e) (f) (d)*0.8 (d)*0.2 Annual Train PT (9) With Project Annual Car PT Annual Bus PT (h) (0) (e) or (e)*0.1 (f) or 0 (a) (b) (c) (b)*X6 (d) (c)*(52-5-20) Annual Train PT () Oor (e)*0.9+() 0 0 1 0 2 0 0 57,600,000 58,320,000 59,049,000 59,787,113 0 3 0 0 0 4 5 6 7 0 0 0 0 8 0 0 9 0 0 0 0 0 0 0 0 0 0 10 11 12 13 14 15 16 17 18 0 0 200,000 202,500 205,031 207,594 210,189 212,816 215,477 218,170 220,897 223,658 226,454 229,285 232, 151 235,053 237,991 240,966 243,978 247,028) 250,115 253,242 256,407 259,613 262,858 266,143 269,470 272,839 276,249 279,702 283, 198 286,738 290,323 1,200,000 1,215,000 1,230,188 1,245,565 1,261,134 1,276,899 1,292,860 1,309,021 1,325,383 1,341,951 1,358,725 1,375,709 1,392,905 1,410,317 1,427,946) 1,445,795 1,463,867 1,482,166 1,500,693 1,519,452 1,538,445 1,557,675 1,577,146 1,596,861 1,616,821 1,637,032 1,657,494 1,678,213 1,699, 191 1,720,431 1,741,936 288,000,000 291,600,000 295,245,000 298,935,563| 302,672,257 306,455,660 310,286,356 314,164,935 318,091,997 322,068,1471 326,093,999) 330,170, 174 334,297,301 338,476,017) 342,706,968 346,990,8051 351,328,190 355,719,792 360,166,290 364,668,368 369,226,723 373,842,057) 378,515,082 383,246,521 388,037,103 392,887,566 397,798,6611 402,771,144 407,805,7831 412,903,356 418,064,648 230,400,000 233,280,000 236,196,000 239, 148,450 242,137,806 245,164,528 248, 229,085 251,331,948 254,473,598 257,654,518 260,875,199 264,136,139 267,437,841 270,780,814 274,165,574 277,592,644 281,062,552 284,575,834 288,133,032 291,734,695 295,381,378 299,073,645 302,812,066 306,597,217 310,429,682 314,310,053 318,238,929 322,216,915 326,244,627 330,322,685 334,451,718 57,600,000 58,320,000 59,049,000 59,787,113 60,534,451 61,291,132 62,057,271 62,832,987 63,618,3991 64,413,629 65,218,800 66,034,035 66,859,460 67,695,2031 68,541,394 69,398,161 70,265,638 71,143,958 72,033,258 72,933,674 73,845,3451 74,768,411 75,703,016 76,649,304 77,607,421 78,577,513 79,559,732 80,554,229 81,561, 157 82,580,671 83,612,930 0 230,400,000 233,280,000 236,196,000 239, 148,450 24,213,781 24,516,453 24,822,908) 25,133,195) 25,447,360 25,765,452 26,087,520 26,413,614 26,743,784 27,078,081 27,416,557 27,759,264) 28, 106,255 28,457,5831 28,813,303 29,173,469 29,538,1381 29,907,365 30,281,207 30,659,722 31,042,968 31,431,005 31,823,893) 32,221,6921 32,624,463 33,032,268 33,445,1721 0 0 0 0 0 278,458,476 281,939,207 285,463,448 289,031,741 292,644,637) 296,302,695 300,006,479 303,756,560 307,553,517 311,397,936 315,290,4101 319,231,540 323,221,935) 327,262,209 331,352,986 335,494,899) 339,688,585 343,934,692 348,233,876) 352,586,7991 356,994,134 361,456,561 365,974,768 370,549,453 375, 181,321 379,871,087) 384,619,476 0 0 0 0 0 0 19 0 0 0 0 0 0 20 21 22 23 24 0 0 0 0 0 0 0 25 261 27 0 0 0 0 0 28 0 0 29 0 0 30 0 0 Problem 3. Economic (Society's) Benefit-Cost Analysis Computing Project's Social Costs Year Annual Fixed Costs Initial Costs (v) = 0 Annual Oper. Costs (x) = (0) Prop. Compen- sation ) (y) = (0) Costs of Traffic Total Delay Costs (2) (aa) (d)*(X6)*(X5+X8)/60 (V)+ ... + (2) (u) (W) = (m) 0 0 1 21 161,250,000 0 0 0 3 144,000,000 145,800,000 147,622,500 149,467,781 0 0 0 70,000,000 70,000,000 70,000,000 70,000,000 0 0 0 0 0 0 0 0 0 0 0 0 0 0 0 0 0 0 0 0 4 5 6 7 8 9 10 11 121 131 14 151 161 171 18 19 201 21 22 23 24 25 26 27 28 291 30 0 0 0 0 0 0 0 45,000,000 45,000,000 45,000,000 45,000,000 45,000,000 45,000,000 45,000,000 45,000,000 45,000,000 45,000,000 45,000,000 45,000,000 45,000,000 45,000,000 45,000,000 45,000,000 45,000,000 45,000,000 45,000,000 45,000,000 45,000,000 45,000,000 45,000,000 45,000,000 45,000,000 45,000,000 45,000,000 0 0 0 44,553,356 45,110,273 45,674,152 46,245,0781 46,823,142 47,408,431 48,001,037 48,601,050 49,208,563 49,823,670 50,446,466 51,077,046 51,715,510 52,361,953 53,016,478 53,679,184) 54,350,174) 55,029,551 55,717,420 56,413,888 57, 119,061 57,833,050 58,555,963 59,287,912 60,029,011 60,779,374 61,539,116 0 0 0 0 0 0 0 0 0) 0 ol 0 0) 0) 0 0 375,250,000 215,800,000 217,622,500 219,467,781 89,553,356 90,110,273 90,674,152 91,245,0781 91,823,142| 92,408,431 93,001,037 93,601,050 94,208,563 94,823,6701 95,446,466 96,077,046 96,715,510 97,361,953 98,016,478 98,679, 184 99,350,174 100,029,5511 100,717,420 101,413,888 102, 119,061) 102,833,050 103,555,963 104,287,912 105,029,011) 105,779,374 106,539,116 0 0 0 0 0 0 0 0 0 0 0 0 0 0 0 0 0 0 0 0 Computing Social Benefits: Net benefits from reduced gasoline reduction Year Annual Car and Annual Miles Ann. Gas Consum. Annual Car and Bus PT w/out Pro Traveled (w/out) w/out Project (gal) Bus PT w/Pro (ac) (ad) (ae) (af) = (d) (ac)*(X2+X4+X6) (ad)/18 (h)+(0) Annual Miles Traveled (w/ Pro) (ag) (af)*(X2+X4+X6) Annual gas consumption occurs for two reasons: (a) reduction in annual PT, and (b) increase in fuel efficiency (from 18 gallons/mile to 25 gallons/mile). Ann. Gas Consum. Savings in Gasoline Price Value (Benefit) of w/ Project (gal) Gas Consumption ($/gal) Gas Saved (ah) (ai) (aj) (ak) (ag)/18 or (ag)/25 (ae)-(ah) (ai)*(aj) (ab) 0 0 1 0 2 0 3 4 5 6 7 8 9 10 11 121 13 14 15 16 17 18 19 20 21 22 231 24 25 26 27 28 288,000,000 291,600,000 295,245,000 298,935,563 302,672,257 306,455,660 310,286,356 314,164,935 318,091,997 322,068,147 326,093,999 330, 170, 1741 334,297,301 338,476,017 342,706,968) 346,990,805 351,328,190 355,719,792 360, 166,290 364,668,368 369,226,723 373,842,057 378,515,082 383,246,521 388,037,103 392,887,566 397,798,661 402,771,144 407,805,783 412,903,356 418,064,648) 4,608,000,000 4,665,600,000 4,723,920,000 4,782,969,000 4,842,756,113 4,903,290,564 4,964,581,696 5,026,638,967 5,089,471,954 5,153,090,354 5,217,503,983 5,282,722,783 5,348,756,818 5,415,616,278 5,483,311,481 5,551,852,875 5,621,251,036 5,691,516,674 5,762,660,632 5,834,693,890 5,907,627,564 5,981,472,908 6,056,241,320 6,131,944,336 6,208,593,640 6,286,201,061 6,364,778,574 6,444,338,306 6,524,892,535 6,606,453,692 6,689,034,363 256,000,000 259,200,000 262,440,000 265,720,500 269,042,006) 272,405,031 275,810,094 279,257,7201 282,748,442 286,282,797 289,861,332 293,484,5991 297,153,157) 300,867,571) 304,628,416 308,436,271 312,291,724 316,195,371) 320, 147,813 324,149,661 328,201,531 332,304,050 336,457,851 340,663,574 344,921,869 349,233,392 353,598,8101 358,018,795 362,494,0301 367,025,205 371,613,020 288,000,000 291,600,000 295,245,000 298,935,563 24,213,781 24,516,453 24,822,908 25,133,195 25,447,360 25,765,452 26,087,520 26,413,614 26,743,784 27,078,081 27,416,557 27,759,264 28, 106,255 28,457,583 28,813,303 29, 173,469 29,538,138 29,907,365 30,281,207 30,659,722 31,042,968 31,431,005) 31,823,893 32,221,692 32,624,463 33,032,268) 33,445,172 4,608,000,000 4,665,600,000 4,723,920,000 4,782,969,000 387,420,489) 392,263,245 397,166,536 402,131, 117 407,157,756 412,247,2281 417,400,319 422,617,823 427,900,545 433,249,302 438,664,919) 444,148,2301 449,700,083 455,321,334 461,012,851 466,775,511 472,610,205 478,517,833) 484,499,306) 490,555,547 496,687,491 502,896,085 509, 182,286 515,547,064 521,991,403 528,516,295) 535,122,7491 256,000,000 259,200,000 262,440,000 265,720,500 15,496,820 15,690,530 15,886,661 16,085,245 16,286,310 16,489,889 16,696,013 16,904,713 17,116,022 17,329,972 17,546,597 17,765,929 17,988,003 18,212,853 18,440,514 18,671,020 18,904,408 19,140,713 19,379,972 19,622,222 19,867,500 20,115,843 20,367,291 20,621,883 20,879,656 21,140,652 21,404,910 0 253,545,187 256,714,502 259,923,433 263,172,476) 266,462,132 269,792,908 273,165,320 276,579,886) 280,037,135 283,537,599 287,081,819 290,670,342 294,303,721 297,982,517 301,707,299 305,478,640 309,297,123 313,163,337 317,077,879 321,041,352 325,054,369 329,117,549 333,231,518 337,396,9121 341,614,374 345,884,553 350,208, 110 1.601 1.65 1.70 1.75 1.80) 1.85 1.91 1.97 2.03 2.09 2.15 2.21 2.28 2.351 2.42 2.49 2.57 2.64 2.72 2.81 2.89 2.98 3.07 3.16 3.25 3.35 3.45 3.55 0 0 0 456,587,746 476,163,946 496,579,475 517,870,320 540,074,010 563,229,683 587,378,156 612,561,994 638,825,590 666,215,237 694,779,215 724,567,874 755,633,722 788,031,517 821,818,369) 857,053,831 893,800,014 932, 121,690 972,086,407 1,013,764,6121 1,057,229,770 1,102,558,496 1,149,830,692 1,199,129,683 1,250,542,368 1,304,159,372 1,360,075,205 3.66 29 3.77 3.881 30 Computing Social Benefits: Benefits from reduced car and bus accidents, benefits of improved air quality, and benefits of reduced travel time. Year Annual Car & Bus Annual Car & Bus Reduction in PT w/out Project PT w/Pro Annual C&B PT (ao) (ap) (aq) (d) (h)+(0) (ao)-(ap) Number of Accidents Avoided Fatal Serious Minor (ar) (as) (at) [0.01*(aq)/1 mil] [0.5*(aq)/1 mil] [2* (aq)/1 mil] Benefits of Accidents Avoided Serious Minor (av) (aw) (as)*100000 (at)* 10000 Fatal (au) (ar)*900000 (an) Benefits of Impro Air Quality (ay) O or 5*X2*75*20 Total (ax) (au)+(av)+(aw) 0 0 0 0 0 0 0 0 0 0 0 0 0 1 0 0 0 2 0 0 0 0 0 0 0 0 3 0 0 4 3 5 3 6 3 7 3 3 8 9 3 10 3 3 11 12 3 3 3 288,000,000 291,600,000 295,245,000 298,935,5631 302,672,257) 306,455,660 310,286,356) 314,164,9351 318,091,997 322,068,147 326,093,999 330,170,174 334,297,301 338,476,017) 342,706,968 346,990,805 351,328, 1901 355,719,792 360,166,290 364,668,368 369,226,7231 373,842,057 378,515,082 383,246,521 388,037,1031 392,887,566 397,798,661 402,771,144 407,805,783 412,903,356) 418,064,648 288,000,000 291,600,000 295,245,000 298,935,563 24,213,781 24,516,453 24,822,908 25,133,195 25,447,360 25,765,452 26,087,5201 26,413,614 26,743,784 27,078,081 27,416,557 27,759,264 28,106,2551 28,457,583 28,813,303 29,173,469 29,538, 138 29,907,365 30,281,207 30,659,722 31,042,968 31,431,005 31,823,893 32,221,692 32,624,463 33,032,268 33,445,172 3 13 14 15 16 17 18 19 20 21 22 23 24 25 3 0 278,458,476 281,939,207) 285,463,448) 289,031,741 292,644,637 296,302,695 300,006,479 303,756,560 307,553,517 311,397,936 315,290,410 319,231,540 323,221,935 327,262,209 331,352,9861 335,494,899 339,688,585 343,934,692 348,233,876 352,586,799 356,994,134 361,456,561 365,974,768 370,549,453 375,181,321 379,871,087 384,619,476) 0 139 141 1431 145 146 148) 1501 152 154 1561 158 160 1621 164 1661 168 1701 172 174 176 1781 181 183 185 1881 190 192 557 564 571 578 585 593 600 608 6151 623 631 638 646 655) 663 671 679 688) 696 705) 714) 723 732 741 750 7601 769 0 2,506,126 2,537,453 2,569, 171 2,601,286 2,633,802 2,666,724| 2,700,058 2,733,809 2,767,982 2,802,581 2,837,614 2,873,084 2,908,997 2,945,360 2,982, 177 3,019,454 3,057,197 3,095,412 3,134, 105 3,173,281 3,212,947 3,253,109 3,293,773 3,334,945 3,376,632 3,418,840 3,461,575 0 13,922,924 14,096,960 14,273, 172 14,451,587 14,632,232 14,815,135 15,000,324 15,187,828 15,377,676 15,569,897 15,764,521 15,961,577 16,161,097 16,363,110 16,567,6491 16,774,745 16,984,429 17,196,735 17,411,694 17,629,3401 17,849,707 18,072,828 18,298,738) 18,527,473 18,759,066 18,993,554 19,230,974 0 5,569, 170 5,638,784 5,709,269 5,780,635 5,852,893 5,926,054 6,000, 130 6,075, 131 6,151,0701 6,227,959) 6,305,808 6,384,631 6,464,439 6,545,244) 6,627,060 6,709,898 6,793,772) 6,878,6941 6,964,6781 7,051,736 7,139,8831 7,229,131 7,319,495 7,410,989 7,503,626 7,597,422 7,692,390 7,500 7,500 7,500 7,500 7,500 7,500 7,500 7,500 7,500 7,500 7,500 7,500 7,500 7,500 7,50C 7,500 7,500 7,500 7,500 7,500 7,500 7,500 0 21,998,2201 22,273,197 22,551,612 22,833,508 23,118,926 23,407,913 23,700,512 23,996,768 24,296,728) 24,600,437 24,907,9421 25,219,292 25,534,533 25,853,714 26,176,886 26,504,097 26,835,398 27,170,841 27,510,476 27,854,357 28,202,537) 28,555,068 28,912,007 29,273,407 29,639,324 30,009,8161 30,384,939 3 3 3 3 3 3 4 4 88ggggg8888 4 4 7,500 4 27 28 29 4 7,500 7,500 7,500 7,500 4 4 Computing Benefits: Total Project Benefits Year Benefits from Gas Reducn. (az) = (ak) Benefits of Redu. Benefits of Impro. Benefits of Travel Traffic accidents Air Quality Time Saved (ba) (bb) (bc) = (ax) = ayy Total Project Benefits (bcc) (az)+(ba)+(bb)+(bc) (ayyy) = (ay) 0 0 0 0 0 1 0 0 0 0 2 0 3 4 5 6 7 8 9 10 11 12 13 14 15 16 17 18 19 20 ol ol 456,587,746 476,163,946 496,579,475 517,870,320 540,074,010 563,229,683 587,378,156) 612,561,994 638,825,590 666,215,237 694,779,2151 724,567,874 755,633,722 788,031,517 821,818,369 857,053,831 893,800,014 932, 121,690 972,086,407 1,013,764,6121 1,057,229,770 1,102,558,496 1,149,830,692 1,199,129,683 1,250,542,368 1,304, 159,372 1,360,075,205) 0 21,998,220 22,273,197 22,551,612 22,833,508 23,118,926 23,407,9131 23,700,5121 23,996,768 24,296,728 24,600,437 24,907,942 25,219,292 25,534,533 25,853,714) 26,176,886 26,504,097 26,835,398 27,170,841 27,510,476 27,854,357 28,202,537 28,555,068 28,912,007 29,273,407 29,639,324 30,009,8161 30,384,939) 0 7,500,000 7,500,000 7,500,000 7,500,000 7,500,000 7,500,000 7,500,000 7,500,000 7,500,000 7,500,000 7,500,000 7,500,000 7,500,000 7,500,000 7,500,000 7,500,000 7,500,000 7,500,000 7,500,000 7,500,000 7,500,000 7,500,000 7,500,000 7,500,000 7,500,000 7,500,000 7,500,000 ol ol 83,537,543 84,581,762 85,639,034 86,709,522 87,793,391 88,890,809 90,001,944 91,126,968 92,266,055 93,419,381 94,587,123 95,769,462 96,966,580 98,178,663 99,405,896 100,648,470 101,906,575 103,180,408 104,470,163 105,776,0401 107,098,240 108,436,968 109,792,430 111,164,836 112,554,396 113,961,326 115,385,843 0 0 0 569,623,509 590,518,905 612,270,122 634,913,350 658,486,327 683,028,405) 708,580,611 735,185,730 762,888,373 791,735,055 821,774,281 853,056,628 885,634,835 919,563,894 954,901,151 991,706,398 1,030,041,988 1,069,972,938 1,111,567,046 1,154,895,009 1,200,030,547 1,247,050,533 1,296,035,129 1,347,067,925 1,400,236,088 1,455,630,514 1,513,345,986 21 22 23 24 25 26 27 28 29 30 Final economic benefits-cost analysis Year Total Project Costs (be) Total Project Benefits (bf) = (bcc) Discounted Total Costs (bg) PV of (be) Discounted Total Benefits (bh) PV of (bf) (bd) = (aa) 0 0 0 1 0 0 2 0 0 3 4 5 6 7 81 9 10 11 12 13 14 15 161 17 18 19 20 21 22 23 24 25 26 27 375,250,000 215,800,000 217,622,500 219,467,781 89,553,356 90,110,273 90,674,152 91,245,078 91,823,142 92,408,431 93,001,037 93,601,050 94,208,563 94,823,670 95,446,466 96,077,046 96,715,510 97,361,953 98,016,478 98,679,184 99,350,174 100,029,551 100,717,420 101,413,888 102, 119,061 102,833,050 103,555,963 104,287,912 105,029,011 105,779,374 106,539,116 0 569,623,509) 590,518,905 612,270,122 634,913,350 658,486,327 683,028,405 708,580,611 735,185,730 762,888,373 791,735,055 821,774,281 853,056,628 885,634,835 919,563,894 954,901, 151 991,706,398 1,030,041,988 1,069,972,938 1,111,567,046 1,154,895,009 1,200,030,547 1,247,050,533 1,296,035,129 1,347,067,925 1,400,236,088 1,455,630,514 1,513,345,986 375,250,000 201,682,243 190,079,920 179, 151,084 68,319,827 64,247,379 60,420,016) 56,822,849 53,441,905 50,264,064 47,277,011 44,469,184 41,829,729 39,348,452 37,015,785 34,822,7431 32,760,8891 30,822,301 28,999,539 27,285,617 25,673,973 24,158,446 22,733,248 21,392,944 20,132,4281 18,946,905 17,831,870 16,783,092 15,796,596 14,868,647 13,995,737 0 434,563,047 421,031,818 407,981,434| 395,392, 125 383,245,038 371,522, 196 360,206,452 349,281,445 338,731,561 328,541,900 318,698,234 309,186,979 299,995,160 291,110,379 282,520,794 274,215,083 266,182,423 258,412,467 250,895,316) 243,621,503 236,581,966 229,768,035 223,171,408 216,784,136 210,598,606 204,607,523 198,803,899 28 29 30 1,876,624,4191 PV (total) NPV B-C Ratio 8,105,650,929 6,229,026,510 4.32 Benefit-Cost Analysis of Metro-Dade Mass Transit Dr. Pallab Mozumder Intro to Eny Econ Cla Final Results: Variables Financial B-C Analysis Economic B-C Analysis My SSN (or New No. Codes 3 3 X1 1 1 X2 5 5 X3 9 9 X4 4 4 X5 6 6 X6 9 9 X7 1 1 X8 7 7 X9 45 X10 Current Gasoline Price ($/gal) = Increase in Gasoline Price = Current Population = ww PV Benefits PV Costs NPV B-C Ratio 4,166,471,729 1,345,413,296 2,821,058,434 3.10 8,105,650,929 1,876,624,419 6,229,026,510 4.32 Initial cost outlay = 280,000,000 1.60 3% 200,000 Annual pop growth = 1.25% Problem 2. Financial Benefit-Cost Analysis Year Total Train Fare Benefits (0) (i)*(9) Discounted Total Costs (s) PV of (p) k) (k) Discounted Total Benefits (0) PV of (0) 0 0 ol 0 0 Initial Annual Fixed Annual Oper Prop. Compen- Total Train Fare Costs Costs Costs sation Costs (S/PT) (0) (m) (n) (0) (p) (9) 9) X10*1.000.000 ()*(X2+X4+X6) 10*X5 1000000 (1)+(m)+(n)+(0) X8/100 1.5+500*3000* X10*1.5 0 70,000,000 0 0 0 161,250,000 231,250,000 1 70,000,000 0 U 0 70,000,000 2 70,000,000 U ol 0 01 70,000,000 31 70,000,000 0 o ol 0 70,000,000 4 4 0 45,000,000 44,553,356 0 0 89.553.3561 5 0 45,000,000 45,110,273 ol un 90,110,273 o 45,000,000 45,674,152 0 90.674 1521 7 45,000,000 46.245,0781 0 91,245,078 www.no 1:240,00 8 0 45,000,000 46,823, 1421 0 www.www.we 91,823,142 a 21.02.142 9 0 45,000,000 47,408,4311 www.me resto 0 92,408,431 10 0 45,000,000 48,001,037 . 0 93,001,037 11 0 45,000,000 48,601,050 wie www.me 0 93,601,050 wie 12 0 45,000,000 49.208.563 0 94,208,563 . 13 0 45,000,000 49,823,670 0 94,823,670 141 0 45,000,000 50.446.466 0 95,446,466 . w 2 we 151 0 45,000,000 51,077,046 0 96,077,046 16 0 45,000,000 51,715,510 0 96,715,510 we 17 0 45,000,000 52,361,953 0 97,361,953 18 2004 0 53,016,478 45,000,000 0 98,016,478 10 527 0 19 45,000,000 53,679,184 0 OD CZ 98,679, 184 20 20 45,000,000 54,350,174 0 99,350,174 21 0 45,000,000 55,029,551 0 0 100,029,551 ..! 22 0 45,000,000 55,717,420 0 100,717,420 wie 231 0 45,000,000 56,413,888 0 101,413,888 . le 24 0 45,000,000 57, 119,061 0 wie 102,119,061 2 25 0 45,000,000 57,833,050 0 102,833,050 26 0 45,000,000 58,555,963 0 103,555,963 27 0 45,000,000 59.287,912 0 104,287,912 281 0 45,000,000 60,029,011 0 105,029,011 291 0 45.000.000 60,779,374 0 105,779,374 30 0 61,539,116 0 106,539,116 U U 0 0 1.20 1.20 1.20 1.20 1.29 1.20 co 1.20 1.20 1.40 1.40 1.40 1.40 1.40 1.40 1.40 1.40 1.40 1.40 1.60 1.60 1.60 1.60 1.60 1.601 1.60 1.60 1.60 1.60 01 01 0 ol 334,150,172 338,327,049 342,556,137 346,838,089 solr.com 351,173,565 355,563,234| www.co 360,007,775 425,259,184 Two 430,574,9241 " 435.957, 1101 www.euro 441,406,5741 446,924,156) 452,510,708 458,167,092 40 463,894,181 469,692,858 231,250,000 65,420,561 61,140,7111 57,140,8511 68,319,827) 64,247,3791 60,420,016) 56,822,849 53,441,905 . 50,264,064 47,277,011 44,469,184 Titolo 41,829,729 39,348,4521 37,015.785 W. 34,822,743 32,760,8891 2000 30,822,301 20 28,999,539 27,285,617 25,673,9731 24,158,446) 22,733,248 21,392,944 20,132,428 18.946,905 4200 17,831,870 16.783.092 15,796,596 14,868,647 13,996,737 u 254,921,566 241,222,510 228,259,618 215,983,33l 204,386,212 10.00,212 193,402,841 180,000 183,009,697 202,037,575 Uwer 191,180,416 2002 20 180,906,702 171, 185,080 161.985,882 con 153,281,033 41 145,043,968) 12 137,249,549 4000 129,873,989 122,894,780 132,903,567 Towe 125,761,553 11 119,003,338 112,608,299 106,556,919 100,830,729 ) 95,412,255 90,284,961 85,433,199 80,842,163 0 475,564,019) 550,295,508 557,174,201 564,138,879 were 571,190,615 578,330,4981 585,559,629 592,879,124 600,290,113 607,793,7401 615,391,161 45,000,000 1,345,413,296 PV (total) NPV B-C Ratio 4,166,471,729 2,821,058,434 3.10 2. Explain how the following concepts or principles have been applied to the B-C analysis conducted in the worksheet (you need to explain the following concepts in terms of actual numbers that you get from your worksheet. Hint: reading chapter 8, 9 & 10 might help in answering this question). a. Opportunity cost principle b. Non-market benefits c. With and without principle d. Operation and maintenance costs e. Public goods f. Damage compensation 3. Compute Internal Rate of Returns for the project (financial and socio-economic), using the worksheet. 4. Present (using appropriate tables) the main results of your analysis: total (30 years) discounted and undiscounted benefits and costs, net present values, B-C ratios and IRRs for both analyses. Based on these results, make recommendations to the MDTA Director as to whether the project is financially and economically viable or not, with justification. Your justification should point to some of the economic principles that we discussed in this course. Also, the recommendation must indicate important project indicators such as benefit-cost ratio, net present values, and internal rate of return. Make sure to explain why you conducted the three types of analyses, what the differences are, etc. 5. Discuss any two funding mechanisms for raising money for this project. Problem 1. Projection of Passenger Trips with and without the Project Years Population Daily total PT Annual PT Without Project Annual Car PT Annual Bus PT (e) (f) (d)*0.8 (d)*0.2 Annual Train PT (9) With Project Annual Car PT Annual Bus PT (h) (0) (e) or (e)*0.1 (f) or 0 (a) (b) (c) (b)*X6 (d) (c)*(52-5-20) Annual Train PT () Oor (e)*0.9+() 0 0 1 0 2 0 0 57,600,000 58,320,000 59,049,000 59,787,113 0 3 0 0 0 4 5 6 7 0 0 0 0 8 0 0 9 0 0 0 0 0 0 0 0 0 0 10 11 12 13 14 15 16 17 18 0 0 200,000 202,500 205,031 207,594 210,189 212,816 215,477 218,170 220,897 223,658 226,454 229,285 232, 151 235,053 237,991 240,966 243,978 247,028) 250,115 253,242 256,407 259,613 262,858 266,143 269,470 272,839 276,249 279,702 283, 198 286,738 290,323 1,200,000 1,215,000 1,230,188 1,245,565 1,261,134 1,276,899 1,292,860 1,309,021 1,325,383 1,341,951 1,358,725 1,375,709 1,392,905 1,410,317 1,427,946) 1,445,795 1,463,867 1,482,166 1,500,693 1,519,452 1,538,445 1,557,675 1,577,146 1,596,861 1,616,821 1,637,032 1,657,494 1,678,213 1,699, 191 1,720,431 1,741,936 288,000,000 291,600,000 295,245,000 298,935,563| 302,672,257 306,455,660 310,286,356 314,164,935 318,091,997 322,068,1471 326,093,999) 330,170, 174 334,297,301 338,476,017) 342,706,968 346,990,8051 351,328,190 355,719,792 360,166,290 364,668,368 369,226,723 373,842,057) 378,515,082 383,246,521 388,037,103 392,887,566 397,798,6611 402,771,144 407,805,7831 412,903,356 418,064,648 230,400,000 233,280,000 236,196,000 239, 148,450 242,137,806 245,164,528 248, 229,085 251,331,948 254,473,598 257,654,518 260,875,199 264,136,139 267,437,841 270,780,814 274,165,574 277,592,644 281,062,552 284,575,834 288,133,032 291,734,695 295,381,378 299,073,645 302,812,066 306,597,217 310,429,682 314,310,053 318,238,929 322,216,915 326,244,627 330,322,685 334,451,718 57,600,000 58,320,000 59,049,000 59,787,113 60,534,451 61,291,132 62,057,271 62,832,987 63,618,3991 64,413,629 65,218,800 66,034,035 66,859,460 67,695,2031 68,541,394 69,398,161 70,265,638 71,143,958 72,033,258 72,933,674 73,845,3451 74,768,411 75,703,016 76,649,304 77,607,421 78,577,513 79,559,732 80,554,229 81,561, 157 82,580,671 83,612,930 0 230,400,000 233,280,000 236,196,000 239, 148,450 24,213,781 24,516,453 24,822,908) 25,133,195) 25,447,360 25,765,452 26,087,520 26,413,614 26,743,784 27,078,081 27,416,557 27,759,264) 28, 106,255 28,457,5831 28,813,303 29,173,469 29,538,1381 29,907,365 30,281,207 30,659,722 31,042,968 31,431,005 31,823,893) 32,221,6921 32,624,463 33,032,268 33,445,1721 0 0 0 0 0 278,458,476 281,939,207 285,463,448 289,031,741 292,644,637) 296,302,695 300,006,479 303,756,560 307,553,517 311,397,936 315,290,4101 319,231,540 323,221,935) 327,262,209 331,352,986 335,494,899) 339,688,585 343,934,692 348,233,876) 352,586,7991 356,994,134 361,456,561 365,974,768 370,549,453 375, 181,321 379,871,087) 384,619,476 0 0 0 0 0 0 19 0 0 0 0 0 0 20 21 22 23 24 0 0 0 0 0 0 0 25 261 27 0 0 0 0 0 28 0 0 29 0 0 30 0 0 Problem 3. Economic (Society's) Benefit-Cost Analysis Computing Project's Social Costs Year Annual Fixed Costs Initial Costs (v) = 0 Annual Oper. Costs (x) = (0) Prop. Compen- sation ) (y) = (0) Costs of Traffic Total Delay Costs (2) (aa) (d)*(X6)*(X5+X8)/60 (V)+ ... + (2) (u) (W) = (m) 0 0 1 21 161,250,000 0 0 0 3 144,000,000 145,800,000 147,622,500 149,467,781 0 0 0 70,000,000 70,000,000 70,000,000 70,000,000 0 0 0 0 0 0 0 0 0 0 0 0 0 0 0 0 0 0 0 0 4 5 6 7 8 9 10 11 121 131 14 151 161 171 18 19 201 21 22 23 24 25 26 27 28 291 30 0 0 0 0 0 0 0 45,000,000 45,000,000 45,000,000 45,000,000 45,000,000 45,000,000 45,000,000 45,000,000 45,000,000 45,000,000 45,000,000 45,000,000 45,000,000 45,000,000 45,000,000 45,000,000 45,000,000 45,000,000 45,000,000 45,000,000 45,000,000 45,000,000 45,000,000 45,000,000 45,000,000 45,000,000 45,000,000 0 0 0 44,553,356 45,110,273 45,674,152 46,245,0781 46,823,142 47,408,431 48,001,037 48,601,050 49,208,563 49,823,670 50,446,466 51,077,046 51,715,510 52,361,953 53,016,478 53,679,184) 54,350,174) 55,029,551 55,717,420 56,413,888 57, 119,061 57,833,050 58,555,963 59,287,912 60,029,011 60,779,374 61,539,116 0 0 0 0 0 0 0 0 0) 0 ol 0 0) 0) 0 0 375,250,000 215,800,000 217,622,500 219,467,781 89,553,356 90,110,273 90,674,152 91,245,0781 91,823,142| 92,408,431 93,001,037 93,601,050 94,208,563 94,823,6701 95,446,466 96,077,046 96,715,510 97,361,953 98,016,478 98,679, 184 99,350,174 100,029,5511 100,717,420 101,413,888 102, 119,061) 102,833,050 103,555,963 104,287,912 105,029,011) 105,779,374 106,539,116 0 0 0 0 0 0 0 0 0 0 0 0 0 0 0 0 0 0 0 0 Computing Social Benefits: Net benefits from reduced gasoline reduction Year Annual Car and Annual Miles Ann. Gas Consum. Annual Car and Bus PT w/out Pro Traveled (w/out) w/out Project (gal) Bus PT w/Pro (ac) (ad) (ae) (af) = (d) (ac)*(X2+X4+X6) (ad)/18 (h)+(0) Annual Miles Traveled (w/ Pro) (ag) (af)*(X2+X4+X6) Annual gas consumption occurs for two reasons: (a) reduction in annual PT, and (b) increase in fuel efficiency (from 18 gallons/mile to 25 gallons/mile). Ann. Gas Consum. Savings in Gasoline Price Value (Benefit) of w/ Project (gal) Gas Consumption ($/gal) Gas Saved (ah) (ai) (aj) (ak) (ag)/18 or (ag)/25 (ae)-(ah) (ai)*(aj) (ab) 0 0 1 0 2 0 3 4 5 6 7 8 9 10 11 121 13 14 15 16 17 18 19 20 21 22 231 24 25 26 27 28 288,000,000 291,600,000 295,245,000 298,935,563 302,672,257 306,455,660 310,286,356 314,164,935 318,091,997 322,068,147 326,093,999 330, 170, 1741 334,297,301 338,476,017 342,706,968) 346,990,805 351,328,190 355,719,792 360, 166,290 364,668,368 369,226,723 373,842,057 378,515,082 383,246,521 388,037,103 392,887,566 397,798,661 402,771,144 407,805,783 412,903,356 418,064,648) 4,608,000,000 4,665,600,000 4,723,920,000 4,782,969,000 4,842,756,113 4,903,290,564 4,964,581,696 5,026,638,967 5,089,471,954 5,153,090,354 5,217,503,983 5,282,722,783 5,348,756,818 5,415,616,278 5,483,311,481 5,551,852,875 5,621,251,036 5,691,516,674 5,762,660,632 5,834,693,890 5,907,627,564 5,981,472,908 6,056,241,320 6,131,944,336 6,208,593,640 6,286,201,061 6,364,778,574 6,444,338,306 6,524,892,535 6,606,453,692 6,689,034,363 256,000,000 259,200,000 262,440,000 265,720,500 269,042,006) 272,405,031 275,810,094 279,257,7201 282,748,442 286,282,797 289,861,332 293,484,5991 297,153,157) 300,867,571) 304,628,416 308,436,271 312,291,724 316,195,371) 320, 147,813 324,149,661 328,201,531 332,304,050 336,457,851 340,663,574 344,921,869 349,233,392 353,598,8101 358,018,795 362,494,0301 367,025,205 371,613,020 288,000,000 291,600,000 295,245,000 298,935,563 24,213,781 24,516,453 24,822,908 25,133,195 25,447,360 25,765,452 26,087,520 26,413,614 26,743,784 27,078,081 27,416,557 27,759,264 28, 106,255 28,457,583 28,813,303 29, 173,469 29,538,138 29,907,365 30,281,207 30,659,722 31,042,968 31,431,005) 31,823,893 32,221,692 32,624,463 33,032,268) 33,445,172 4,608,000,000 4,665,600,000 4,723,920,000 4,782,969,000 387,420,489) 392,263,245 397,166,536 402,131, 117 407,157,756 412,247,2281 417,400,319 422,617,823 427,900,545 433,249,302 438,664,919) 444,148,2301 449,700,083 455,321,334 461,012,851 466,775,511 472,610,205 478,517,833) 484,499,306) 490,555,547 496,687,491 502,896,085 509, 182,286 515,547,064 521,991,403 528,516,295) 535,122,7491 256,000,000 259,200,000 262,440,000 265,720,500 15,496,820 15,690,530 15,886,661 16,085,245 16,286,310 16,489,889 16,696,013 16,904,713 17,116,022 17,329,972 17,546,597 17,765,929 17,988,003 18,212,853 18,440,514 18,671,020 18,904,408 19,140,713 19,379,972 19,622,222 19,867,500 20,115,843 20,367,291 20,621,883 20,879,656 21,140,652 21,404,910 0 253,545,187 256,714,502 259,923,433 263,172,476) 266,462,132 269,792,908 273,165,320 276,579,886) 280,037,135 283,537,599 287,081,819 290,670,342 294,303,721 297,982,517 301,707,299 305,478,640 309,297,123 313,163,337 317,077,879 321,041,352 325,054,369 329,117,549 333,231,518 337,396,9121 341,614,374 345,884,553 350,208, 110 1.601 1.65 1.70 1.75 1.80) 1.85 1.91 1.97 2.03 2.09 2.15 2.21 2.28 2.351 2.42 2.49 2.57 2.64 2.72 2.81 2.89 2.98 3.07 3.16 3.25 3.35 3.45 3.55 0 0 0 456,587,746 476,163,946 496,579,475 517,870,320 540,074,010 563,229,683 587,378,156 612,561,994 638,825,590 666,215,237 694,779,215 724,567,874 755,633,722 788,031,517 821,818,369) 857,053,831 893,800,014 932, 121,690 972,086,407 1,013,764,6121 1,057,229,770 1,102,558,496 1,149,830,692 1,199,129,683 1,250,542,368 1,304,159,372 1,360,075,205 3.66 29 3.77 3.881 30 Computing Social Benefits: Benefits from reduced car and bus accidents, benefits of improved air quality, and benefits of reduced travel time. Year Annual Car & Bus Annual Car & Bus Reduction in PT w/out Project PT w/Pro Annual C&B PT (ao) (ap) (aq) (d) (h)+(0) (ao)-(ap) Number of Accidents Avoided Fatal Serious Minor (ar) (as) (at) [0.01*(aq)/1 mil] [0.5*(aq)/1 mil] [2* (aq)/1 mil] Benefits of Accidents Avoided Serious Minor (av) (aw) (as)*100000 (at)* 10000 Fatal (au) (ar)*900000 (an) Benefits of Impro Air Quality (ay) O or 5*X2*75*20 Total (ax) (au)+(av)+(aw) 0 0 0 0 0 0 0 0 0 0 0 0 0 1 0 0 0 2 0 0 0 0 0 0 0 0 3 0 0 4 3 5 3 6 3 7 3 3 8 9 3 10 3 3 11 12 3 3 3 288,000,000 291,600,000 295,245,000 298,935,5631 302,672,257) 306,455,660 310,286,356) 314,164,9351 318,091,997 322,068,147 326,093,999 330,170,174 334,297,301 338,476,017) 342,706,968 346,990,805 351,328, 1901 355,719,792 360,166,290 364,668,368 369,226,7231 373,842,057 378,515,082 383,246,521 388,037,1031 392,887,566 397,798,661 402,771,144 407,805,783 412,903,356) 418,064,648 288,000,000 291,600,000 295,245,000 298,935,563 24,213,781 24,516,453 24,822,908 25,133,195 25,447,360 25,765,452 26,087,5201 26,413,614 26,743,784 27,078,081 27,416,557 27,759,264 28,106,2551 28,457,583 28,813,303 29,173,469 29,538, 138 29,907,365 30,281,207 30,659,722 31,042,968 31,431,005 31,823,893 32,221,692 32,624,463 33,032,268 33,445,172 3 13 14 15 16 17 18 19 20 21 22 23 24 25 3 0 278,458,476 281,939,207) 285,463,448) 289,031,741 292,644,637 296,302,695 300,006,479 303,756,560 307,553,517 311,397,936 315,290,410 319,231,540 323,221,935 327,262,209 331,352,9861 335,494,899 339,688,585 343,934,692 348,233,876 352,586,799 356,994,134 361,456,561 365,974,768 370,549,453 375,181,321 379,871,087 384,619,476) 0 139 141 1431 145 146 148) 1501 152 154 1561 158 160 1621 164 1661 168 1701 172 174 176 1781 181 183 185 1881 190 192 557 564 571 578 585 593 600 608 6151 623 631 638 646 655) 663 671 679 688) 696 705) 714) 723 732 741 750 7601 769 0 2,506,126 2,537,453 2,569, 171 2,601,286 2,633,802 2,666,724| 2,700,058 2,733,809 2,767,982 2,802,581 2,837,614 2,873,084 2,908,997 2,945,360 2,982, 177 3,019,454 3,057,197 3,095,412 3,134, 105 3,173,281 3,212,947 3,253,109 3,293,773 3,334,945 3,376,632 3,418,840 3,461,575 0 13,922,924 14,096,960 14,273, 172 14,451,587 14,632,232 14,815,135 15,000,324 15,187,828 15,377,676 15,569,897 15,764,521 15,961,577 16,161,097 16,363,110 16,567,6491 16,774,745 16,984,429 17,196,735 17,411,694 17,629,3401 17,849,707 18,072,828 18,298,738) 18,527,473 18,759,066 18,993,554 19,230,974 0 5,569, 170 5,638,784 5,709,269 5,780,635 5,852,893 5,926,054 6,000, 130 6,075, 131 6,151,0701 6,227,959) 6,305,808 6,384,631 6,464,439 6,545,244) 6,627,060 6,709,898 6,793,772) 6,878,6941 6,964,6781 7,051,736 7,139,8831 7,229,131 7,319,495 7,410,989 7,503,626 7,597,422 7,692,390 7,500 7,500 7,500 7,500 7,500 7,500 7,500 7,500 7,500 7,500 7,500 7,500 7,500 7,500 7,50C 7,500 7,500 7,500 7,500 7,500 7,500 7,500 0 21,998,2201 22,273,197 22,551,612 22,833,508 23,118,926 23,407,913 23,700,512 23,996,768 24,296,728) 24,600,437 24,907,9421 25,219,292 25,534,533 25,853,714 26,176,886 26,504,097 26,835,398 27,170,841 27,510,476 27,854,357 28,202,537) 28,555,068 28,912,007 29,273,407 29,639,324 30,009,8161 30,384,939 3 3 3 3 3 3 4 4 88ggggg8888 4 4 7,500 4 27 28 29 4 7,500 7,500 7,500 7,500 4 4 Computing Benefits: Total Project Benefits Year Benefits from Gas Reducn. (az) = (ak) Benefits of Redu. Benefits of Impro. Benefits of Travel Traffic accidents Air Quality Time Saved (ba) (bb) (bc) = (ax) = ayy Total Project Benefits (bcc) (az)+(ba)+(bb)+(bc) (ayyy) = (ay) 0 0 0 0 0 1 0 0 0 0 2 0 3 4 5 6 7 8 9 10 11 12 13 14 15 16 17 18 19 20 ol ol 456,587,746 476,163,946 496,579,475 517,870,320 540,074,010 563,229,683 587,378,156) 612,561,994 638,825,590 666,215,237 694,779,2151 724,567,874 755,633,722 788,031,517 821,818,369 857,053,831 893,800,014 932, 121,690 972,086,407 1,013,764,6121 1,057,229,770 1,102,558,496 1,149,830,692 1,199,129,683 1,250,542,368 1,304, 159,372 1,360,075,205) 0 21,998,220 22,273,197 22,551,612 22,833,508 23,118,926 23,407,9131 23,700,5121 23,996,768 24,296,728 24,600,437 24,907,942 25,219,292 25,534,533 25,853,714) 26,176,886 26,504,097 26,835,398 27,170,841 27,510,476 27,854,357 28,202,537 28,555,068 28,912,007 29,273,407 29,639,324 30,009,8161 30,384,939) 0 7,500,000 7,500,000 7,500,000 7,500,000 7,500,000 7,500,000 7,500,000 7,500,000 7,500,000 7,500,000 7,500,000 7,500,000 7,500,000 7,500,000 7,500,000 7,500,000 7,500,000 7,500,000 7,500,000 7,500,000 7,500,000 7,500,000 7,500,000 7,500,000 7,500,000 7,500,000 7,500,000 ol ol 83,537,543 84,581,762 85,639,034 86,709,522 87,793,391 88,890,809 90,001,944 91,126,968 92,266,055 93,419,381 94,587,123 95,769,462 96,966,580 98,178,663 99,405,896 100,648,470 101,906,575 103,180,408 104,470,163 105,776,0401 107,098,240 108,436,968 109,792,430 111,164,836 112,554,396 113,961,326 115,385,843 0 0 0 569,623,509 590,518,905 612,270,122 634,913,350 658,486,327 683,028,405) 708,580,611 735,185,730 762,888,373 791,735,055 821,774,281 853,056,628 885,634,835 919,563,894 954,901,151 991,706,398 1,030,041,988 1,069,972,938 1,111,567,046 1,154,895,009 1,200,030,547 1,247,050,533 1,296,035,129 1,347,067,925 1,400,236,088 1,455,630,514 1,513,345,986 21 22 23 24 25 26 27 28 29 30 Final economic benefits-cost analysis Year Total Project Costs (be) Total Project Benefits (bf) = (bcc) Discounted Total Costs (bg) PV of (be) Discounted Total Benefits (bh) PV of (bf) (bd) = (aa) 0 0 0 1 0 0 2 0 0 3 4 5 6 7 81 9 10 11 12 13 14 15 161 17 18 19 20 21 22 23 24 25 26 27 375,250,000 215,800,000 217,622,500 219,467,781 89,553,356 90,110,273 90,674,152 91,245,078 91,823,142 92,408,431 93,001,037 93,601,050 94,208,563 94,823,670 95,446,466 96,077,046 96,715,510 97,361,953 98,016,478 98,679,184 99,350,174 100,029,551 100,717,420 101,413,888 102, 119,061 102,833,050 103,555,963 104,287,912 105,029,011 105,779,374 106,539,116 0 569,623,509) 590,518,905 612,270,122 634,913,350 658,486,327 683,028,405 708,580,611 735,185,730 762,888,373 791,735,055 821,774,281 853,056,628 885,634,835 919,563,894 954,901, 151 991,706,398 1,030,041,988 1,069,972,938 1,111,567,046 1,154,895,009 1,200,030,547 1,247,050,533 1,296,035,129 1,347,067,925 1,400,236,088 1,455,630,514 1,513,345,986 375,250,000 201,682,243 190,079,920 179, 151,084 68,319,827 64,247,379 60,420,016) 56,822,849 53,441,905 50,264,064 47,277,011 44,469,184 41,829,729 39,348,452 37,015,785 34,822,7431 32,760,8891 30,822,301 28,999,539 27,285,617 25,673,973 24,158,446 22,733,248 21,392,944 20,132,4281 18,946,905 17,831,870 16,783,092 15,796,596 14,868,647 13,995,737 0 434,563,047 421,031,818 407,981,434| 395,392, 125 383,245,038 371,522, 196 360,206,452 349,281,445 338,731,561 328,541,900 318,698,234 309,186,979 299,995,160 291,110,379 282,520,794 274,215,083 266,182,423 258,412,467 250,895,316) 243,621,503 236,581,966 229,768,035 223,171,408 216,784,136 210,598,606 204,607,523 198,803,899 28 29 30 1,876,624,4191 PV (total) NPV B-C Ratio 8,105,650,929 6,229,026,510 4.32 Benefit-Cost Analysis of Metro-Dade Mass Transit Dr. Pallab Mozumder Intro to Eny Econ Cla Final Results: Variables Financial B-C Analysis Economic B-C Analysis My SSN (or New No. Codes 3 3 X1 1 1 X2 5 5 X3 9 9 X4 4 4 X5 6 6 X6 9 9 X7 1 1 X8 7 7 X9 45 X10 Current Gasoline Price ($/gal) = Increase in Gasoline Price = Current Population = ww PV Benefits PV Costs NPV B-C Ratio 4,166,471,729 1,345,413,296 2,821,058,434 3.10 8,105,650,929 1,876,624,419 6,229,026,510 4.32 Initial cost outlay = 280,000,000 1.60 3% 200,000 Annual pop growth = 1.25% Problem 2. Financial Benefit-Cost Analysis Year Total Train Fare Benefits (0) (i)*(9) Discounted Total Costs (s) PV of (p) k) (k) Discounted Total Benefits (0) PV of (0) 0 0 ol 0 0 Initial Annual Fixed Annual Oper Prop. Compen- Total Train Fare Costs Costs Costs sation Costs (S/PT) (0) (m) (n) (0) (p) (9) 9) X10*1.000.000 ()*(X2+X4+X6) 10*X5 1000000 (1)+(m)+(n)+(0) X8/100 1.5+500*3000* X10*1.5 0 70,000,000 0 0 0 161,250,000 231,250,000 1 70,000,000 0 U 0 70,000,000 2 70,000,000 U ol 0 01 70,000,000 31 70,000,000 0 o ol 0 70,000,000 4 4 0 45,000,000 44,553,356 0 0 89.553.3561 5 0 45,000,000 45,110,273 ol un 90,110,273 o 45,000,000 45,674,152 0 90.674 1521 7 45,000,000 46.245,0781 0 91,245,078 www.no 1:240,00 8 0 45,000,000 46,823, 1421 0 www.www.we 91,823,142 a 21.02.142 9 0 45,000,000 47,408,4311 www.me resto 0 92,408,431 10 0 45,000,000 48,001,037 . 0 93,001,037 11 0 45,000,000 48,601,050 wie www.me 0 93,601,050 wie 12 0 45,000,000 49.208.563 0 94,208,563 . 13 0 45,000,000 49,823,670 0 94,823,670 141 0 45,000,000 50.446.466 0 95,446,466 . w 2 we 151 0 45,000,000 51,077,046 0 96,077,046 16 0 45,000,000 51,715,510 0 96,715,510 we 17 0 45,000,000 52,361,953 0 97,361,953 18 2004 0 53,016,478 45,000,000 0 98,016,478 10 527 0 19 45,000,000 53,679,184 0 OD CZ 98,679, 184 20 20 45,000,000 54,350,174 0 99,350,174 21 0 45,000,000 55,029,551 0 0 100,029,551 ..! 22 0 45,000,000 55,717,420 0 100,717,420 wie 231 0 45,000,000 56,413,888 0 101,413,888 . le 24 0 45,000,000 57, 119,061 0 wie 102,119,061 2 25 0 45,000,000 57,833,050 0 102,833,050 26 0 45,000,000 58,555,963 0 103,555,963 27 0 45,000,000 59.287,912 0 104,287,912 281 0 45,000,000 60,029,011 0 105,029,011 291 0 45.000.000 60,779,374 0 105,779,374 30 0 61,539,116 0 106,539,116 U U 0 0 1.20 1.20 1.20 1.20 1.29 1.20 co 1.20 1.20 1.40 1.40 1.40 1.40 1.40 1.40 1.40 1.40 1.40 1.40 1.60 1.60 1.60 1.60 1.60 1.601 1.60 1.60 1.60 1.60 01 01 0 ol 334,150,172 338,327,049 342,556,137 346,838,089 solr.com 351,173,565 355,563,234| www.co 360,007,775 425,259,184 Two 430,574,9241 " 435.957, 1101 www.euro 441,406,5741 446,924,156) 452,510,708 458,167,092 40 463,894,181 469,692,858 231,250,000 65,420,561 61,140,7111 57,140,8511 68,319,827) 64,247,3791 60,420,016) 56,822,849 53,441,905 . 50,264,064 47,277,011 44,469,184 Titolo 41,829,729 39,348,4521 37,015.785 W. 34,822,743 32,760,8891 2000 30,822,301 20 28,999,539 27,285,617 25,673,9731 24,158,446) 22,733,248 21,392,944 20,132,428 18.946,905 4200 17,831,870 16.783.092 15,796,596 14,868,647 13,996,737 u 254,921,566 241,222,510 228,259,618 215,983,33l 204,386,212 10.00,212 193,402,841 180,000 183,009,697 202,037,575 Uwer 191,180,416 2002 20 180,906,702 171, 185,080 161.985,882 con 153,281,033 41 145,043,968) 12 137,249,549 4000 129,873,989 122,894,780 132,903,567 Towe 125,761,553 11 119,003,338 112,608,299 106,556,919 100,830,729 ) 95,412,255 90,284,961 85,433,199 80,842,163 0 475,564,019) 550,295,508 557,174,201 564,138,879 were 571,190,615 578,330,4981 585,559,629 592,879,124 600,290,113 607,793,7401 615,391,161 45,000,000 1,345,413,296 PV (total) NPV B-C Ratio 4,166,471,729 2,821,058,434 3.10
Step by Step Solution
There are 3 Steps involved in it

Get step-by-step solutions from verified subject matter experts