

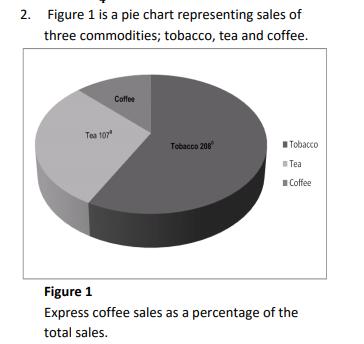
2. Figure 1 is a pie chart representing sales of three commodities; tobacco, tea and coffee....
Fantastic news! We've Found the answer you've been seeking!
Question:
Expert Answer:

Related Book For 
Posted Date:
