

Question: 2. Find out the elements that are relevant to the cost of equity of Tesla: To estimate the cost of equity for TSLA, go to
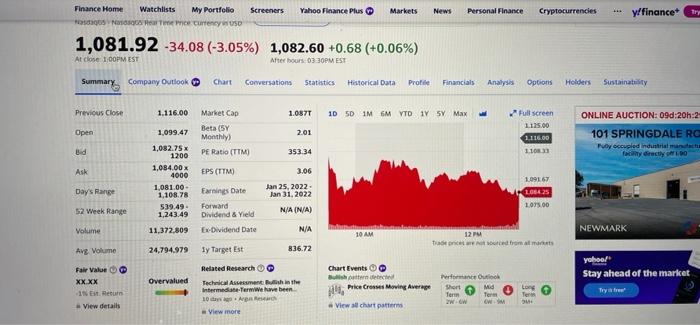
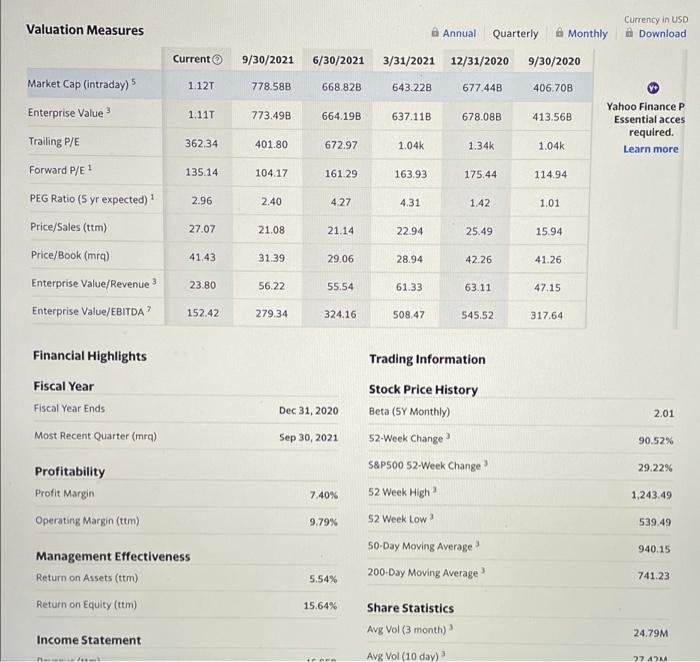
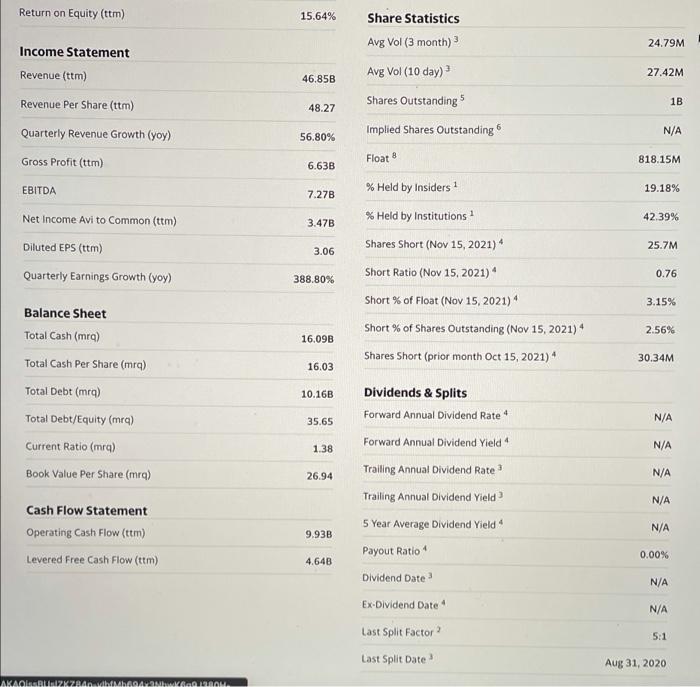
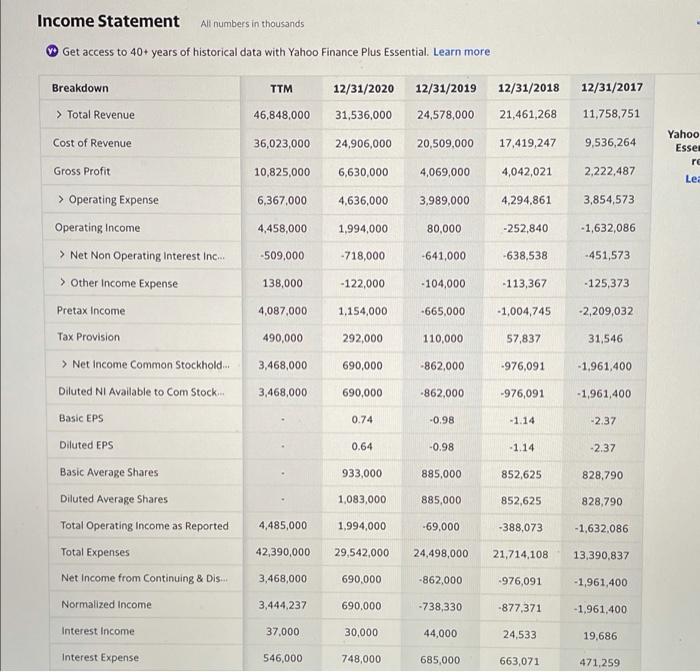
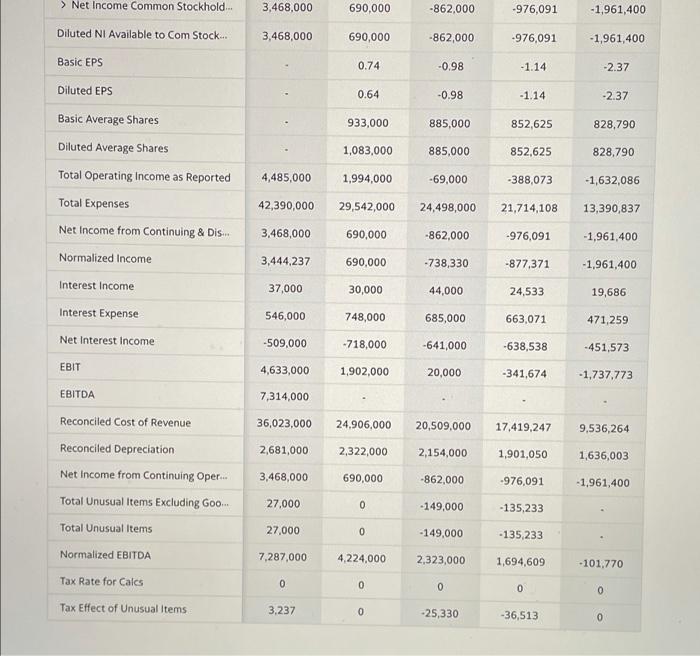
2. Find out the elements that are relevant to the cost of equity of Tesla: To estimate the cost of equity for TSLA, go to and enter the ticker symbol TSLA. Use the information available on Yahool Finance to answer the following questions: (1) What is the most recent stock price listed for TSLAP (2) How many shares of stock does TSLA have outstanding? (3) What is the market value of equity, or market capitalization? (4) What is the most recent annual dividend? (5) Can you use the dividend discount model in this case? (6) What is the beta for TSLA as shown? Try to find other online sources to get different versions of TSLA beta - are those beta having the same value? Why? Finance Home Watchlists My Portfolio Near Mee currency.150 Screeners Yahoo Finance Plus Markets News Personal Finance Cryptocurrencies y/financet tre 1,081.92 -34.08 (-3.05%) 1,082.60 +0.68 (+0.06%) At close 1:00PM EST After bours: 03:30PM EST Summary Company Outlook Chart Conversations Statistics Historical Data Profile Financials Analysis Options Holders Sustainability Previous Close 1.116.00 1.0877 10 50 MM VO V SY Max Open 1.099.47 Market Cap Beta (SY Monthly) PE Ratio (TTM 201 Full screen 1.135.00 1.116.00 1.10.33 ONLINE AUCTION: 090:20h:2 101 SPRINGDALE RC Puy occupled Indutrial and Grectly Bd 353 34 Ask EPS (TTM) 3.06 1,0967 Day's Range 1,082.75 1200 1,084.00 4000 1,081.00 - 1,108.78 539.49 1,243.49 11,372.809 Earnings Date Jan 25, 2022 Jan 31, 2022 52 Week Range N/A (N/A) 1075.00 Forward Dividend & Yield Ex-Dividend Date Volume N/A 10 AM NEWMARK 12PM Terms Avg Volume 24,794.979 1y Target Est 836.72 Fair Value XX XX IN E View details Overvalued Related Research Technical Assements in the Intermediateurwe have been 10.A View more Chart Events Bushatenetected Price Cross Moving Average View all chart patterns yohool Stay ahead of the market Try Peace Outlook Short Mid Term Wow OW 0 Long Te 0 Valuation Measures Annual Quarterly Monthly Currency in USD A Download Current 9/30/2021 6/30/2021 3/31/2021 12/31/2020 9/30/2020 1.12T 778.58B 668.82B 643.22B 677.44B 406.70B Market Cap (intraday) Enterprise Value 1.117 773.49B 664.19B 637.11B 678.08B 413.56B Yahoo Finance P Essential acces required. Learn more 362.34 401.80 672.97 1.04 1.34k 1.04k Trailing P/E Forward P/E 1 135.14 104.17 161.29 163.93 175.44 114.94 2.96 2.40 4.27 4.31 1.42 1.01 PEG Ratio (5 yr expected) Price/Sales (ttm) 27.07 21.08 21.14 22.94 25.49 15.94 Price/Book (mra) 41.43 31.39 29.06 28.94 42.26 41.26 Enterprise Value/Revenue 3 23.80 56.22 55.54 61.33 63.11 47.15 Enterprise Value/EBITDA? 152.42 279.34 324.16 508.47 545.52 317.64 Financial Highlights Trading Information Fiscal Year Fiscal Year Ends Most Recent Quarter (mra) Dec 31, 2020 Stock Price History Beta (SY Monthly) 52-Week Change 2.01 Sep 30, 2021 90.52% 29.22% Profitability Profit Margin S&P500 52-Week Change 52 Week High 7.40% 1,243.49 Operating Margin (ttm) 9.79% 539.49 52 Week Low 50-Day Moving Average 200-Day Moving Average 940.15 Management Effectiveness Return on Assets (ttm) 5.54% 741.23 Return on Equity (ttm) 15.64% Share Statistics Avg Vol (3 month) Avg Vol (10 day) 24.79M Income Statement 2747 Return on Equity (ttm) 15.64% Share Statistics Avg Vol (3 month) 24.79M Income Statement Revenue (ttm) Avg Vol (10 day) 27.42M 46.85B Revenue Per Share (ttm) Shares Outstanding 1B 48.27 6 Quarterly Revenue Growth (yoy) Implied Shares Outstanding N/A 56.80% Gross Profit (ttm) Float 818.15M 6.63B EBITDA % Held by Insiders 1 19.18% 7.27B Net Income Avi to Common (ttm) 42.39% 3.47B % Held by Institutions Shares Short (Nov 15, 2021) Diluted EPS (ttm) 25.7M 3.06 Quarterly Earnings Growth (yoy) Short Ratio (Nov 15, 2021) 0.76 388.80% 3.15% Short % of Float (Nov 15, 2021) Short % of Shares Outstanding (Nov 15, 2021) Shares Short (prior month Oct 15, 2021) 4 2.56% 16.09B 30.34M Balance Sheet Total Cash (mra) Total Cash Per Share (mra) Total Debt (mra) Total Debt/Equity (mra) 16.03 10.16B Dividends & Splits Forward Annual Dividend Rate 4 35.65 N/A Current Ratio (mra) Forward Annual Dividend Yield" 1.38 N/A Book Value Per Share (mra) 26.94 N/A N/A N/A Cash Flow Statement Operating Cash Flow (ttm) Levered Free Cash Flow (tm) 9.93B Trailing Annual Dividend Rate Trailing Annual Dividend Yield de 5 Year Average Dividend Yield Payout Ratio Dividend Date Ex-Dividend Date Last Split Factor 0.00% 4.648 N/A N/A 5:1 Last Split Date 3 Aug 31, 2020 AKAOLUCRUZKO MAILAM Income Statement All numbers in thousands Get access to 40+ years of historical data with Yahoo Finance Plus Essential. Learn more Breakdown TTM 12/31/2020 12/31/2018 12/31/2017 12/31/2019 24,578,000 > Total Revenue 46,848,000 31,536,000 21,461,268 11,758,751 Cost of Revenue 36,023,000 24,906,000 20,509,000 17,419,247 9,536,264 Yahoo Essel ra Le 10,825,000 6,630,000 4,069,000 4,042,021 2,222,487 Gross Profit > Operating Expense 6,367,000 4,636,000 3,989,000 4,294.861 3,854,573 Operating Income 4,458,000 1,994,000 80,000 -252,840 -1,632,086 > Net Non Operating Interest Inc... -509,000 -718,000 -641,000 -638,538 -451,573 138,000 -122,000 - 104,000 -113,367 - 125,373 > Other Income Expense Pretax Income 4,087,000 1,154,000 -665,000 -1,004,745 -2,209,032 Tax Provision 490,000 292,000 110,000 57,837 31,546 > Net Income Common Stockhold... 3,468,000 690,000 -862,000 -976,091 -1.961,400 Diluted NI Available to Com Stock 3,468,000 690,000 -862.000 -976,091 -1,961,400 Basic EPS 0.74 -0.98 -1.14 -2.37 Diluted EPS 0.64 -0.98 -1.14 -2.37 933,000 885,000 852,625 828,790 1,083,000 885,000 852,625 828,790 4,485,000 1,994.000 -69,000 -388,073 -1.632,086 Basic Average Shares Diluted Average Shares Total Operating Income as Reported Total Expenses Net Income from Continuing & Dis. Normalized Income 42,390,000 29,542,000 24.498,000 21,714,108 13,390,837 3,468,000 690.000 -862,000 .976,091 - 1,961,400 3,444,237 690,000 -738,330 -877.371 -1,961,400 Interest Income 37,000 30,000 44,000 24,533 19,686 Interest Expense 546,000 748,000 685,000 663,071 471,259 > Net Income Common Stockhold... 3,468,000 690,000 -862,000 -976,091 -1,961,400 Diluted NI Available to Com Stock... 3,468,000 690,000 -862,000 -976,091 -1,961,400 Basic EPS 0.74 -0.98 -1.14 -2.37 Diluted EPS 0.64 -0.98 -1.14 -2.37 933,000 885,000 852,625 828,790 Basic Average Shares Diluted Average Shares Total Operating Income as Reported 1,083,000 885,000 852,625 828,790 4,485,000 1,994,000 -69,000 -388,073 -1,632,086 Total Expenses 42,390,000 29,542,000 24,498,000 21,714,108 13,390,837 Net Income from Continuing & Dis... 3,468,000 690,000 -862.000 -976,091 -1,961,400 Normalized Income 3,444,237 690,000 -738,330 -877,371 -1,961,400 Interest Income 37,000 30,000 44,000 24,533 19,686 Interest Expense 546,000 748,000 685,000 663,071 471,259 Net Interest Income -509,000 -718,000 -641,000 -638,538 -451,573 EBIT 4,633,000 1,902,000 20,000 -341,674 - 1,737,773 EBITDA 7,314,000 Reconciled Cost of Revenue 36,023,000 24.906,000 20,509,000 17.419,247 9,536,264 2,681,000 2,322,000 2,154,000 1,901,050 1,636,003 Reconciled Depreciation Net Income from Continuing Oper... Total Unusual Items Excluding Goo... 3,468,000 690,000 -862,000 -976,091 -1,961,400 27,000 0 - 149,000 -135,233 27,000 0 - 149,000 -135,233 Total Unusual Items Normalized EBITDA 7,287,000 4,224,000 2,323,000 1,694,609 -101,770 Tax Rate for Cales 0 0 0 0 0 Tax Effect of Unusual Items 3,237 0 -25,330 -36,513 0
Step by Step Solution
There are 3 Steps involved in it

Get step-by-step solutions from verified subject matter experts