

Question: 2. Fixed and variable costs for four potential plant locations are shown below: Plant Location Fixed Cost Per Variable Year ($) Cost Per Unit ($)
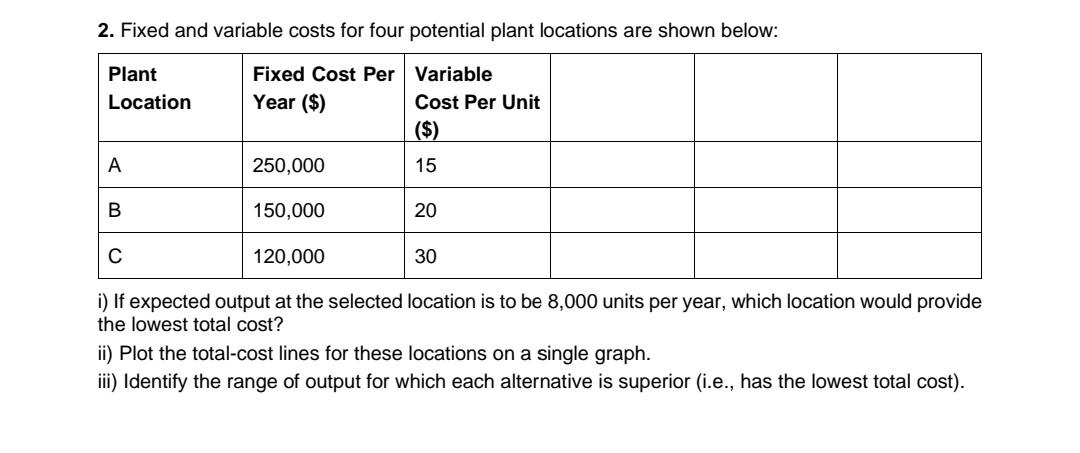
2. Fixed and variable costs for four potential plant locations are shown below: Plant Location Fixed Cost Per Variable Year ($) Cost Per Unit ($) A 250,000 15 B 150,000 20 C 120,000 30 i) If expected output at the selected location is to be 8,000 units per year, which location would provide the lowest total cost? ii) Plot the total-cost lines for these locations on a single graph. iii) Identify the range of output for which each alternative is superior (i.e., has the lowest total cost)
Step by Step Solution
There are 3 Steps involved in it
1 Expert Approved Answer
Step: 1 Unlock

Question Has Been Solved by an Expert!
Get step-by-step solutions from verified subject matter experts
Step: 2 Unlock
Step: 3 Unlock