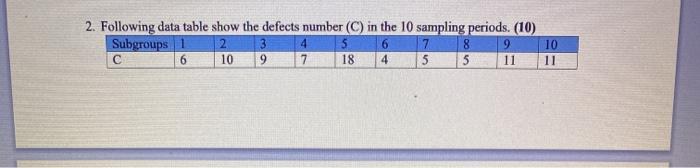
Question: 2. Following data table show the defects number (C) in the 10 sampling periods. (10) Subgroups 1 2 3 4 5 6 7 8 9

2. Following data table show the defects number
2. Following data table show the defects number (C) in the 10 sampling periods. (10) Subgroups 1 2 3 4 5 6 7 8 9 6 10 9 7 18 4 5 5 11 10 11 a) Design C-control chart and determine whether the attribute based process is in-control or not? b) If the process is out-of-control, please redesign the standard control chart with in-control condition

Step by Step Solution

There are 3 Steps involved in it

1 Expert Approved Answer
Step: 1 Unlock blur-text-image
Question Has Been Solved by an Expert!

Get step-by-step solutions from verified subject matter experts

Step: 2 Unlock
Step: 3 Unlock

Students Have Also Explored These Related General Management Questions!