

Question: 2. For a blackbody there is a relationship between the wavelength of emission maximum and the temperature. This relationship is shown through Wien's law hc
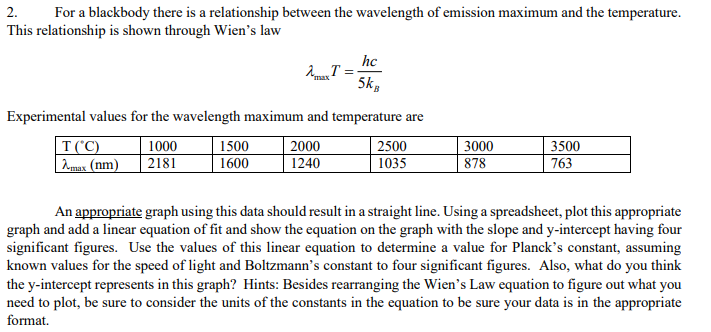
2. For a blackbody there is a relationship between the wavelength of emission maximum and the temperature. This relationship is shown through Wien's law hc "max 5k Experimental values for the wavelength maximum and temperature are T("C) 1000 1500 2000 2500 Zumax (nm) 2181 1600 1240 1035 3000 878 3500 763 An appropriate graph using this data should result in a straight line. Using a spreadsheet, plot this appropriate graph and add a linear equation of fit and show the equation on the graph with the slope and y-intercept having four significant figures. Use the values of this linear equation to determine a value for Planck's constant, assuming known values for the speed of light and Boltzmann's constant to four significant figures. Also, what do you think the y-intercept represents in this graph? Hints: Besides rearranging the Wien's Law equation to figure out what you need to plot, be sure to consider the units of the constants in the equation to be sure your data is in the appropriate format
Step by Step Solution
There are 3 Steps involved in it

Get step-by-step solutions from verified subject matter experts