

Question: 2- For each business write an evaluation paragraph assessing the performance of the management (mention relevant specific median ratios). Which business of Industry 1 has
2- For each business write an evaluation paragraph assessing the performance of the management (mention relevant specific median ratios).
Which business of Industry 1 has the best management? Which has the worst management?
Which business of Industry 2 has the best management? Which has the worst management?
3- Which of the two industries is more attractive to operate a business? Why?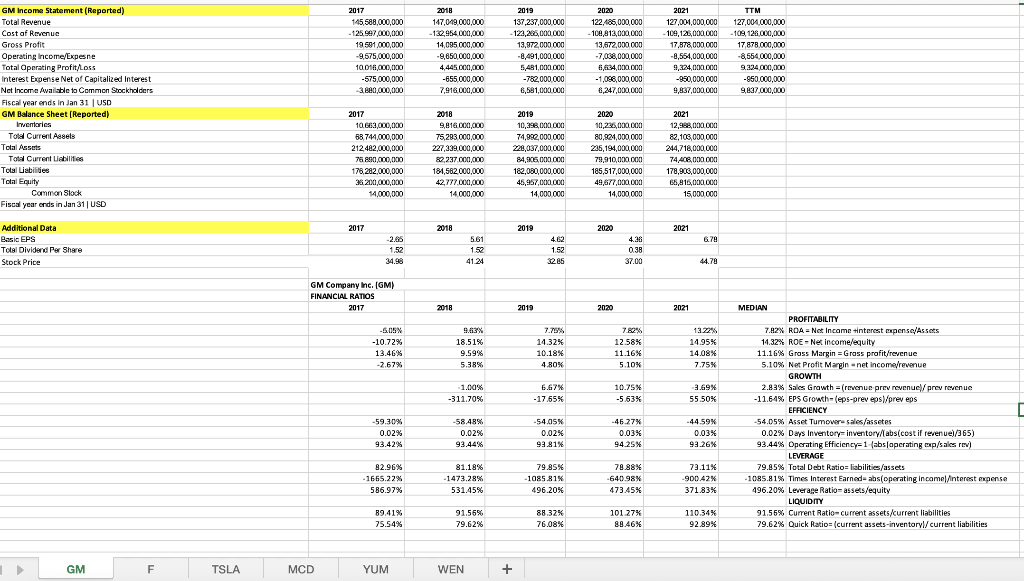
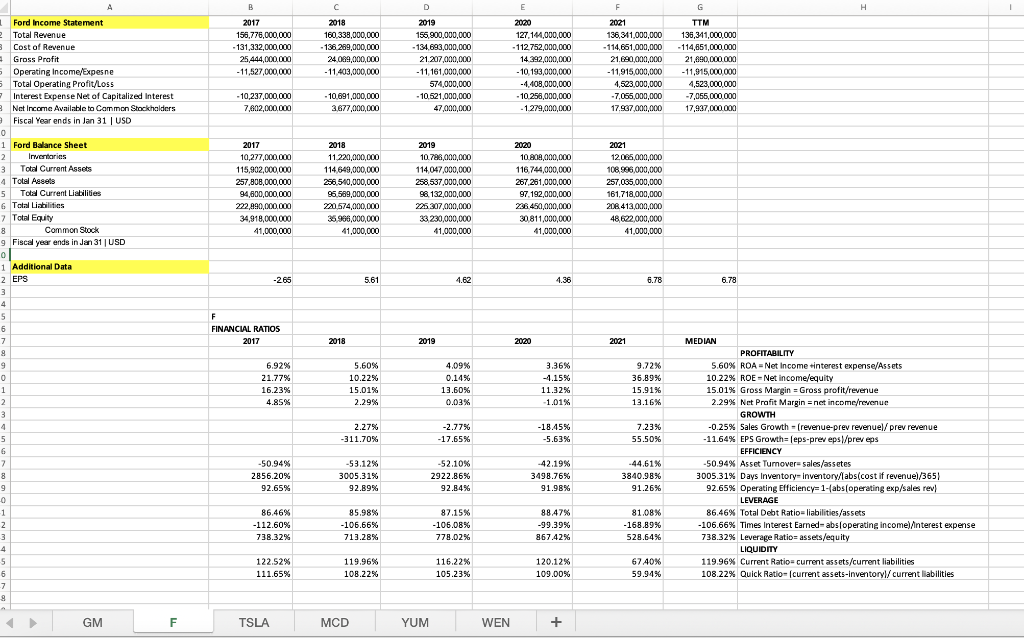
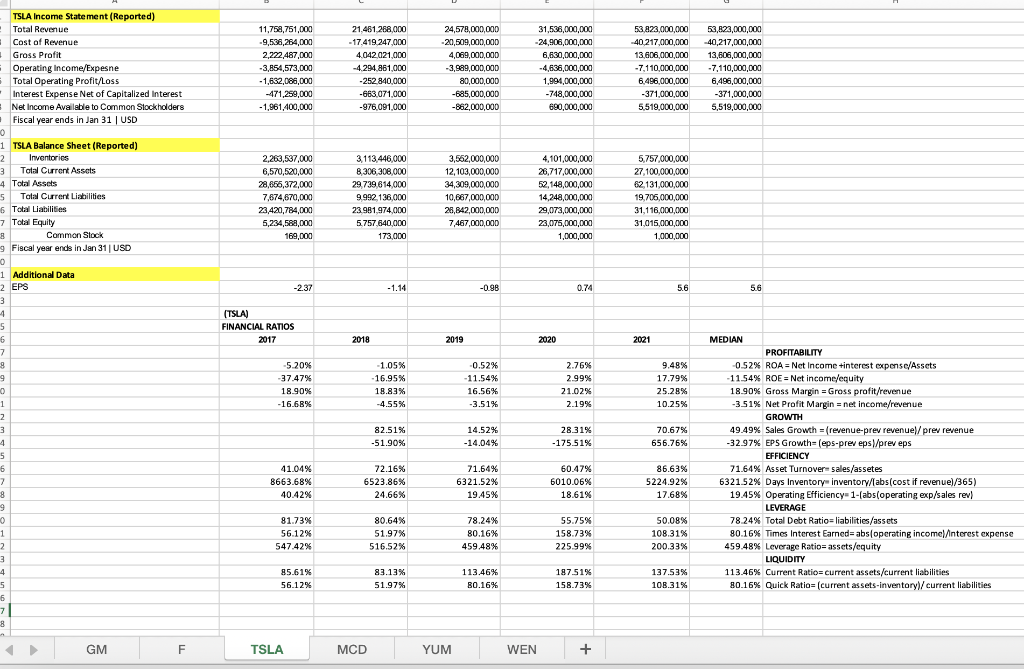
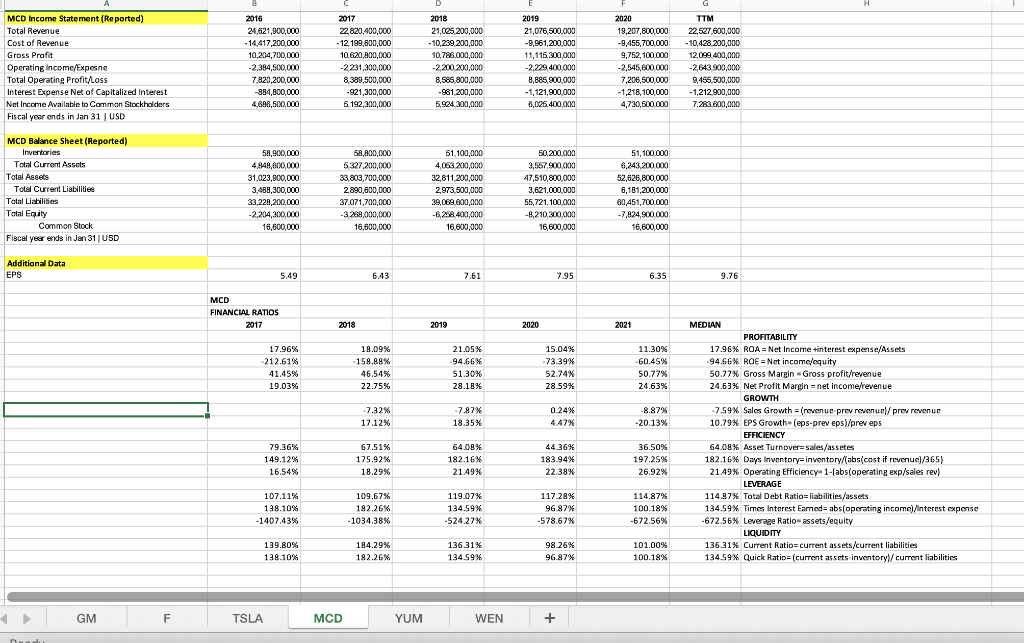
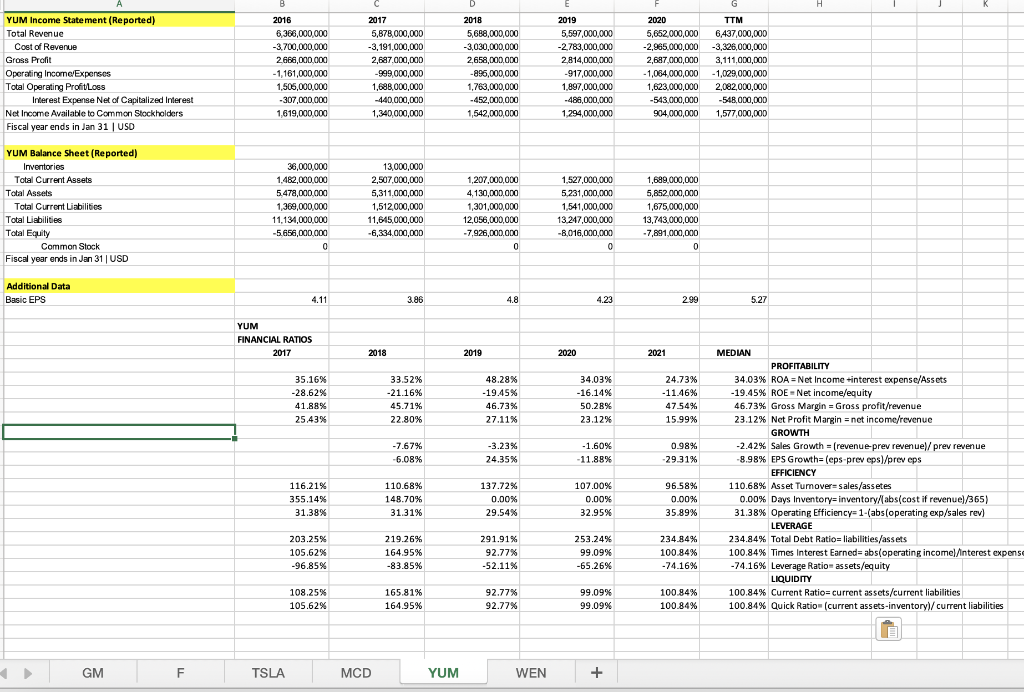
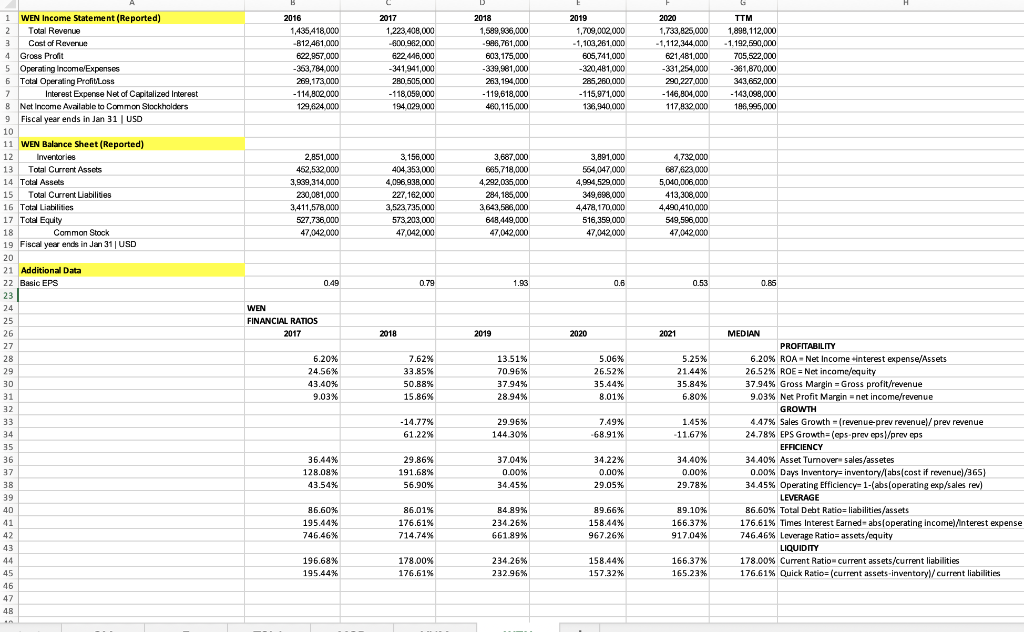
2017 145,588,000,000 - 125.967,000,000 19.501,000,000 -9,575,000,000 10.000.000.000 -575,000,000 3.880,000,000 2018 147,019,000,000 -132,954.000,000 14,085 000.000 -9,850.000.000 4.445.000.000 -655 000,000 7.916.000.000 2019 137,237,000,000 -122,285,000,000 13,872,000.000 -8,491,000,000 5,481,000.000 -782,000,000 6,581,000.000 2020 122,485,000,000 -108,913,000,000 13,672,000 000 -7.038,000,000 6,694.000.000 -1,098,000,000 8,247,000,000 2021 127,001,000,000 109,125,000.000 17,878 000 000 -8,564,000,000 9.324.000.000 -850,000,000 9,837,000,000 TTM 127,00/1.000,000 -109, 128.000.000 17,878.000.000 -8,554.000,000 9.324,000,000 -950.000.000 9,837.000.000 GM Income Statement(Reported) Total Revenue Cost af Revenue Gross Profit Operating income/Expesne Total Operating profit oss Interest Expense Net of Capitalized interest Net Income Available to Common Stockholders Fiscal year ends in Jan 31 USD GM Balance Sheet(Reported) ) Inventories Told Current Assets Total Assets Total Current alles Total abilities Total Equity Common Stock Fiscal year ends in Jan 31 USD 2017 10.663,000,000 68 744,000,000 212 482,000,000 76.890,000,000 178.282.000.000 38 200,000,000 14,000,000 2018 9,816000.000 75,283.000.000 227,339,000,000 82.237 000.000 181,562,000,000 42,777.000.000 14000,000 2019 10,298,000,000 74,892,000.000 220,037,000,000 84,326 000 000 182,080,000,000 45,957,000,000 14,000000 2020 10,235,000,000 80,924,000,000 225.194.000.000 79,910,000 000 185,517,000,000 49,677,000,000 14,000000 2021 12,998.000.000 82,103,000 000 244,718,000,000 74,408.000.000 178,900,000,000 68,815,000.000 15,000.000 2017 2018 2019 2020 2021 6.78 Additional Data Basic EPS Total Dividend per Share Stock Price -2.25 1.52 34.98 5.61 1.52 41.24 4.62 1.52 32.85 4.36 0.38 37.00 44.79 GM Company Inc. (GM) FINANCIAL RATIOS 2017 2018 2019 2020 2021 -5.05 % -10.72% 13.46% -7.67% 9.63% 18.51% 9.59% 5.38% 7.75% 14.32% 10.18% 4.80% 7.80% 12.58% 11.16% 5.10% 13.22% 14.95% 14.08% 7.75% -1.00% -311.70% 6.67% - 17.65% 10.75% -5.63% 3.69% 55.50% -59.30% 0.02% 93.42% -58.48%. 0.02% 93.44% -54.05% 0.02% 93.81% -46.27% 0.03% 94.25% -44.59% 0.03% 93.26% MEDIAN PROFITABILITY 7.92X ROA = Net Income interest expense/Assets 14.32% ROE - Net Income/equity 11.16% Grass Margin = Grass profit/revenue 5.10% Net Profit Margin-net income revenue GROWTH 2.83% Sales Growth (revenue prev revenue/prev revenue -11.64% EPS Growth-eps-prev eps/prev eps EFFICIENCY -54.05% Asset Tumowrsales/assetes 0.02% Days Inventory Inventory/abs(cost if revenue)/365) 93.44% Operating Efficiency=1(abs (aperating exp/sales rev) LEVERAGE 79.85% Total Debt Ratio liabilities/assets -1085.81% Times Interest Farned-abs(operating income Anterest expense 496.20% Leverage Ratio-assets/equity LIQUIDITY 91.55% Current Ratio current assets/current liabilities 79.62% Quick Ratio=(current assets-inventory/current liabilities 92.96% - 1655.22% 586.97% 81.18% -1473.28% 531.45% 79.85% -1085.81% 496.20% 79.88% -640.98% 473 45% 72.11% -900.42% 371.83% 89.41% 75.54% 91.55% 79.62% 88.32% 76.08% 101.27% 88.46% 110.34% 92.89% GM F TSLA MCD YUM WEN + A E F G H B 2017 156,776,000,000 - 131,332,000,000 25,444,000,000 -11,527,000,000 2018 160 338,000,000 -138 289,000,000 24 089,000,000 -11 403,000,000 D 2019 155,900,000,000 -134,693,000,000 21.207,000,000 - 11,161,000,000 574,000,000 - 10,521,000,000 47,000,000 2020 127 12,000,000 - 112.752,000,000 14.392,000,000 - 10, 193,000,000 -1.408.000.000 - 10.256,000,000 - 1279,000,000 2021 136,311,000,000 - 114,651,000,000 21.690,000,000 - 11,915,000,000 4,523,000,000 -7,065,000,000 17.967,000,000 TTM 136,31,000,000 - 114,651,000,000 21,690,000,000 -11,915 000 000 4,523,000,000 -7,055.000.000 17,927,000.000 -10,237,000,000 10.691,000,000 3.677,000,000 7.402,000,000 2017 10,277,000,000 115,902,000,000 257,808,000,000 94,600,000,000 222,990,000,000 34,918,000,000 41,000,000 2018 11 220,000,000 114649,000,000 256,510,000,000 96.589.000.000 220.574,000,000 36 966,000,000 41,000,000 2019 10.728,000,000 114 047,000,000 258,537,000,000 96.132,000,000 225 307,000,000 33,230,000,000 41,000,000 2020 10 04,000,000 116.744,000,000 267,251,000,000 97. 192,000,000 238 450,000,000 30.811,000,000 41.000.000 2021 12.015.000.000 106,986,000,000 257,035,000,000 161,718,000,000 206 413,000,000 48 622,000,000 41,000,000 -265 5.61 4.62 4.36 6.78 6.78 Ford Income Statement e Total Revenue 3 Cost of Revenue # Gross Profit 5 Operating Income/Expesne Total Operating Profit/Loss Interest Expense Net of Capitalized interest Net Income Available to Common Stockholders Fiscal Year ends in Jan 31 USD 0 1 Ford Balance Sheet 2 2 Inventories 3 Total Current Assets 4 Total Assets 5 Total Current Liabilities 6 Total Liabilities 7 Total Equity 8 Common Stock 9 Fiscal year ends in Jan 31 USD 0 ol 1 Additional Data 2 EPS 3 4 4 5 6 7 8 8 9 0 1 2 2 3 4 5 6 6 7 8 9 0 1 2 2 3 4 4 5 6 -7 9 F F FINANCIAL RATIOS 2017 2018 2019 2020 2021 6.92% 21.77% 16.23% 4.85% 5.60% 10.22% 15.01% 2.29% 4.09% 0.14% 13.60% 0.03% 3.36% -4.15% 11.32% -1.01% 9.72% 36.89% 15.91% 13.16% 2.27% % -311.70% -2.77% -18.45% -5.63% 7.23% 55.50% -17.65% -50.94% 2856.20% 92.65% MEDIAN PROFITABILITY 5.60% ROA - Net Income interest expense/Assets 10.22% ROE - Net Income/equity 15.01% Gross Margin = Gross profit/revenue 2.29% Net Profit Margin = net income/revenue GROWTH -0.25% Sales Growth - (revenue-prev revenuel/ prev revenue -11.64% EPS Growth= leps-prev eps/prev eps EFFICIENCY -50.94% Asset Turnover-sales/assetes 3005.31% Days Inventory-inventory/labs(cost if revenue)/365) 92.65% Operating Efficiency=1.abs(operating exp/sales rev! LEVERAGE 86.46% Total Debt Ratio=liabilities/assets -106.66% Times Interest Earned-abs operating income)terest expense 738.32% Leverage Ratios assets/equity LIQUIDITY 119.96% Current Ratio= current assets/current liabilities 108.22% Quick Ratio- (current assets-inventoryl/ current liabilities -53.12% 3005.31% 92.89% -52.10% 2922.86% 92.84% -42.19% 3498.76% 91.98% -44.61% 3840.98% 91.26% 86,46% -112.60% 738.32% 85.98% -106.66% 713.28% 87.15% -105.08% 778.02% 88.47% -99.39% 867.42% 81.08% -168.89% 528.64% 122.52% 111.65% 119.96% 10B.22% 116.22% 105.23% 120.12% 109.00% 67.40% 59.94% GM F TSLA MCD YUM WEN + 11,758,751,000 -9,536,264,000 2,222,487,000 -3,854,573,000 - 1,682,086,000 -471,259,000 -1,961,400,000 21.461 268.000 -17.419.247,000 4.042021.000 -4.294 861,000 -252 840.000 -663.071,000 -976,091,000 24,578,000,000 20,509,000,000 4,069,000,000 -3.999.000.000 80,000,000 -685,000,000 -862,000,000 31,536,000,000 -24,906,000,000 6,630,000,000 -4,636,000,000 1,994,000,000 -748,000,000 690,000,000 53.823,000,000 40.217,000,000 13.606,000,000 -7.110.000.000 6.496,000,000 -371,000,000 5,519,000,000 53,822,000,000 40,217,000,000 13,606,000,000 -7.110,000,000 6,496,000,000 -371,000,000 5,519,000,000 2,263,537,000 6,570,520,000 28,656,372,000 7,674,670,000 23,420,784,000 5,234,588,000 169.000 3,113,446,000 8.306,308,000 29,739,614,000 9,992.136.000 23.981,974.000 5.757.640.000 173,000 3,562,000,000 12, 103,000,000 34,309,000,000 10,667,000,000 26,842,000,000 7,467,000,000 4,101.000.000 26,717,000,000 52,148,000,000 14,248,000,000 29,073,000,000 23,075,000,000 1,000,000 5.757,000,000 27.100,000,000 62,131,000,000 19,706,000,000 31,116,000,000 31,015,000,000 1,000,000 -2.37 - 1.14 -0.98 0.74 5.6 5.6 TSLA Income Statement(Reported) Total Revenue Cost of Revenue Gross Profit Operating Income/Expesne Total Operating Profit/Loss Interest Expense Net of Capitalized Interest Net Income Available to Common Stockholders Fiscal year ends in Jan 31 USD 0 1 TSLA Balance Sheet (Reported) 2 Inventories 3 Total Current Assets 4 Total Assets 5 Total Current Liabilities 6 Total Liabilities 7 Total Equity 8 Common Stock 9 Fiscal year ends in Jan 31 USD 0 1 Additional Data 2 EPS 3 4 5 6 7 g 9 0 1 2 2 3 4 5 6 7 8 9 0 1 1 2 3 4 5 6 7 7 8 (TSLA) FINANCIAL RATIOS 2017 2018 2019 2020 2021 -5.20% 37.47% 18.90% - 16.68% -1.05% 16.95% 18.83% -4.55% -0.52% 11.54% 16.56% -3.51% 2.76% 2.99% 21.02% 2.19% 9.48% 17.79% 25.28% 10.25% 82.51% -51.90% 14.52% -14.04% 28.31% - 175.51% 70.67% 656.76% 41.04% 8663.68% 40.42% 72.16% 6523.86% 24.66% 71.64% 6321.52% 19.45% 60.47% 6010.06% 18.61% 86.63% 5224.92% 17.68% MEDIAN PROFITABILITY 0.52% ROA = Net Income interest expense/Assets -11.54% ROE = Net income/equity 18.90% Gross Margin=Gross profit/revenue -3.51% Net Profit Margin = net income/revenue GROWTH 49.49% Sales Growth = (revenue-prev revenue)/prev revenue -32.97% EPS Growth= (eps-prev eps/prev eps EFFICIENCY 71.64% Asset Turnover-sales/assetes 6321.52% Days Inventory inventory/abs(cost if revenue)/365) 19.45% Operating Efficiency=1-(abs (operating exp/sales rev) (/! LEVERAGE 78.24% Total Debt Ratio=liabilities/assets % 80.16% Times Interest Earned=abs(operating income) Ainterest expense 459.48% Leverage Ratio=assets/equity LIQUIDITY 113.46% Current Ratio= current assets/current liabilities 80.16% Quick Ratio= (current assets-inventory/current liabilities 81.73% 56.12% 547.42% 80.64% 51.97% 516.52% 78.24% 80.16% 459.48% 55.75% 158.73% 225.99% 50.08% 108.31% 200.33% 85.61% 56.12% 83.13% 51.97% 113.46% B0.16% 187.51% 158.73% 137.53% 108.31% GM F TSLA MCD YUM WEN + H 2017 MCD Income Statement (Reported) Total Revenue Cost of Revenue Gross Profit Operating Income/Expesne Total Operating Profit/Loss Interest Expense Net of Capitalized Interest Net Income Available to Common Stockholders Fiscal year ends in Jan 31 USD 1 2016 24,621,900,000 -14,417,200,000 10,204,700,000 -2,394,500,000 7,820,200,000 -884.800.000 4,698,500,000 22.820,400,000 - 12.199,600,000 10.620,800,000 -2 231,300,000 8.389,500,000 -921,300,000 5.192,300,000 2018 21,025,200,000 -10,239,200,000 10,786.000,000 -2,200 200,000 8,585 800.000 -981,200,000 5,924.300,000 2019 21,076,500,000 -9,961,200,000 11,115,300,000 -2,229,400,000 8,885,900.000 -1,121.900.000 8,025, 400,000 2020 19,207,800,000 -9,455,700,000 9,752, 100.000 -2,545,600.000 7,206,500,000 -1,218,100,000 4,730,500,000 TTM 22,527,600,000 -10,428,200,000 12,099.400,000 -2.643.900,000 9,456 500,000 - 1.212 900,000 7.283.600,000 MCD Balance Sheet(Reported) Inventories Total Current Assets Total Assets Total Current Liabilities Tatal Liabilities Total Equity Common Stock Fiscal year ends in Jan 31 USD 50,900,000 4,848,600,000 31,023,900,000 3,468,300,000 33,228,200,000 -2,204,300,000 16,600,000 58,800,000 5327,200,000 33 803,700,000 2.890,600,000 37.071,700,000 -3288,000,000 16,600,000 61,100,000 4,083.200,000 32,811,200,000 2,973.500,000 39,069.600,000 -6,208 400,000 16 600,000 50.200.000 3,557 900,000 47,510 800 000 3,621,000,000 55,721,100,000 -8,210,300,000 16.600.000 51,100.000 6,243,200.000 52,626,800,000 6,181,200,000 80,451,700.000 -7,924,900.000 16,600,000 Additional Data EPS 5.49 6.43 7.61 7.95 6.35 9.76 MCD FINANCIAL RATIOS 2017 2018 2019 2020 2021 17.96% 212.61% 41.45% 19.03% 18.09% -158.88% 46.54% 22.75% 21.05% -94.66% 51.30% 28.18% 15.04% -73.39% 52.74% 28.59% 11.30% -60.45% 50.77% 24.63% -7.32% 17.12% -7.87% 18.35% 0.24% 4.47% 8.87% -20.13% 79.36% 149.12% 16.54% MEDIAN PROFITABILITY 17.96% ROA = Net Income interest expense/Assets .94.66% ROE = Net incomc/equity 50.77% Gross Margin-Gross profit/revenue 24.63% Net Profit Margin = net income/revenue GROWTH -7.59% Sales Growth = (revenue-prev revenuel/prev revenue 10.79% EPS Growth-(eps-prev eps)/prev eps EFFICIENCY 64.08% Asset Turnover-sales/assetes 182.16% Days Inventory=inventory/(abs(cost if revenue)/365) 21.49% Operating Efficiency 1-(abs(operating exp/sales rev) LEVERAGE 114.87% Total Debt Ratio=liabilities/assets 134.59% Times Interest Eameda abs(operating income)/interest expense -672.56% Leverage Ratio-assets/equity LIQUIDITY 136.31% Current Ratio= current assets/current liabilities 134.59% Quick Ratio=(current assets inventory/current liabilities 67.51% 175.92% 18.29% 64.08% 182.16% 21.49% 44.36% 183.94% 22 38% 36.50% 197.25% 26.92% 107.11% 138.10% -1407.43% 109.67% 182.26% - 1034.38% 119.07% 134.59% -524.27% 117.28% 96.87% -578.67% 114.87% 100.18% -672.56% 139.80% 138.10% 184.29% 182.26% 136.31% 134.59% % 98.26% 96.87% 101.00% 100.18% GM F TSLA MCD YUM WEN + Dan H YUM Income Statement (Reported) Total Revenue Cost of Revenue Grass Profit Operating Income Expenses Total Operating ProfitLOGS Interest Expense Net of Capitalized Interest Net Income Available to Common Stockholders Fiscal year ends in Jan 31 USD 2016 6,366,000,000 -3.700,000,000 2668,000,000 -1,161,000,000 1,505,000,000 -307,000.000 1,619,000,000 2017 5,878,000,000 -3,191,000,000 2,687,000,000 -999,000,000 1,688,000,000 -440,000,000 1,340.000,000 2018 5,688,000,000 -3,030,000,000 2,658,000,000 -895,000,000 1,763,000,000 -452,000,000 1,542,000,000 2019 5,597,000,000 -2.783,000,000 2,814,000,000 -917,000,000 1,897,000,000 -486,000.000 1,294,000,000 2020 5,652,000,000 -2,965,000,000 2.697 000,000 -1,064,000,000 1,623,000,000 -543,000,000 904,000,000 TTM 6,437,000,000 -3,326,000,000 3,111,000,000 - 1,029,000,000 2,082.000.000 -548,000,000 1,577,000,000 YUM Balance Sheet (Reported) Inventories Total Current Assets Total Assets Total Current Liabilities Total Liabilities Total Equity Common Stock Fiscal year ends in Jan 31 USD 36,000,000 1.482,000,000 5.478,000,000 1,369,000,000 11,134,000,000 -5.656,000,000 0 13,000,000 2.507.000.000 5,311,000,000 1,512,000,000 11,645,000,000 -6,334.000.000 1,207,000,000 4,130,000,000 1,301,000,000 12,056,000,000 -7,926,000,000 0 1,527,000,000 5.231,000,000 1,541,000,000 13.247,000,000 -8,016,000,000 0 1,699,000,000 5,852,000,000 1.675.000.000 13,743,000,000 -7,891,000,000 0 0 Additional Data Basic EPS 4.11 3.96 4.8 4.23 2.99 5.27 YUM FINANCIAL RATIOS 2017 2018 2019 2020 2021 35.16% -28.62% 41.88% 25.43% 33.52% -21.16% 45.71% 22.80% 48.28% -19.45% 46.73% 27.11% 34.03% -16.14% 50.28% 23.12% % 24.73% -11.46% 47.54% 15.99% -7.67% -6.08% -3.23% 24.35% -1.60% - 11.88% 0.98% -29.31% MEDIAN PROFITABILITY 34.03% ROA - Net Income interest expense/Assets -19.45% ROE .Net income/equity 46.73% Gross Margin = Gross profit/revenue 23.12% Net Profit Margin = net income/revenue GROWTH -2.42% Sales Growth (revenue-prev revenue/prev revenue -8.98% EPS Growth-(eps prev eps/prev eps EFFICIENCY 110.68% Asset Tumover-sales/assetes 0.00% Days Inventory=inventory/(abs(cost if revenue)/365) 31.38% Operating Efficiency=1-(abs(operating exp/sales rev) LEVERAGE 234.84% Total Debt Ratio= liabilities/assets 100.84% Times Interest Earned=abs(operating income)/Interest expense -74.16% Leverage Ratio assets/equity LIQUIDITY 100.84% Current Ratio= current assets/current liabilities 100.84% Quick Ratio (current assets-inventory/current liabilities 116.21% 355.14% 31.38% 110.68% 148.70% 31.31% 137.72% 0.00% 29.54% 107.00% 0.00% 32.95% 96.58% 0.00% 35.89% 203.25% 105.62% -96.85% 219.26% 164.95% -83.85% 291.91% 92.77% -52.11% 253.24% 99.09% -65.26% 234.84% 100.84% -74.16% 108.25% 105.62% 165.81% 164.95% 92.77% 92.77% 99.09% 99.09% 100.84% 100.84% GM F TSLA MCD YUM WEN + H 2019 2016 1,435,418,000 -B12,461,000 622,957.000 -363,784,000 269,173.000 - 114,802,000 129,824.000 2017 1,223,408,000 -600 962.000 622.416,000 341 441,000 280.505,000 -118,059,000 194029,000 2018 1,589,938,000 -998,761,000 603,175,000 -339,981.000 263,194,000 - 119,618,000 460,115,000 1,709,002.000 - 1,100,261.000 605,741,000 -320 481 000 285,260.000 -115,971,000 136,940,000 2020 1,733,825,000 - 1,112,344.000 621,481,000 -331,254 000 290,227.000 -146,804,000 117,832 000 TTM 1.898, 112.000 -1.192,590,000 705,522,000 -361,870,000 343,662,000 - 143,000,000 188,995,000 2,851.000 462,532.000 3,939,314,000 230.081.000 3,411,578,000 527,736 000 47,042000 3,156,000 404 353,000 4,096,938,000 227.162,000 3,523.735,000 573,203,000 47042,000 3,687,000 665, 718,000 4.292,035,000 284, 185.000 3.643,516.000 648,449,000 47,042,000 3,891,000 564,047.000 4.994.529.000 349,696,000 4,478,170.000 516,359.000 47,042000 4,732.000 687,623,000 5,040,006,000 413.308 000 4,490,410,000 519,506.000 47,042,000 0.49 0.79 1.93 0.6 0.53 0.85 1 WEN Income Statement (Reported) 2 Total Revenue 3 Cost of Revenue 4 Groes Profit 5 Operating Income Expenses 6 Total Operating ProfitLoss 7 7 Interest Expense Net of Capitalized Interest 8 Net Income Available to Common Stockholders 9 Fiscal year ends in Jan 31 USD 10 11 WEN Balance Sheet(Reported) 12 Inventories 13 Total Current Assets 14 Total Assets 15 Total Current Liabilities 16 Total Liabilities 17 Total Equity 18 Common Stock 19 Fiscal year ends in Jan 31 USD 20 21 Additional Data 22 Basic EPS 23 24 25 26 27 28 29 30 31 32 33 34 35 36 37 38 39 40 41 42 43 44 45 46 47 48 WEN FINANCIAL RATOS 2017 2018 2019 2020 2021 6.20% 24.56% 43.40% 9.03% 7.62% 33.85% 50.88% 15.86% 13.51% 70.96% 37.94% 28.94% 5.06% 26.52% 35.44% 8.01% 5.25% 21.44% 35.84% 6.80% -14.77% 61.22% 29.96% 144.30% 7.49% -68.91% 1.45% -11.67% 36.44% 128.09% 43.54% 29.86% 191.68% 56.90% 37.04% 0.00% 34.45% 34.22% 0.00% 29.05% 34.40% 0.00% 29.78% MEDIAN PROFITABILITY 6.20% ROA - Net Income interest expense/Assets 26.52% ROE Net income/equity 37.94% Gross Margin = Gross profit/revenue 9.03% Net Profit Margin = net income/revenue GROWTH 4.47% Sales Growth (revenue-prev revenuel/prev revenue 24.78% EPS Growth=(eps-prev eps\/prev eps EFFICIENCY 34.40% Asset Turnover sales/assetes 0.00% Days Inventory=inventory/(abs(cost if revenue)/365) 34.45% Operating Efficiency=1-(abs(operating exp/sales rev) LEVERAGE 86.60% Total Debt Ratio= liabilities/assets 176.61% Times Interest Earned=abs(operating income)/Interest expense 746.46% Leverage Ratio-assets/equity LIQUIDITY 178.00% Current Ratio current assets/current liabilities 176.61% Quick Ratio=(current assets-inventory/current liabilities 86.60% 195.44% 746.46% 86.01% 176.61% 714.74% 84.89% 234.26% 661.89% 89.66% 158.44% 967.26% 89.10% 166.37% 917.04% 196.68% 195.44% 178.00% 176.61% 234.26% 232.96% 158.44% 157.32% 166.37% 165.23%
Step by Step Solution
There are 3 Steps involved in it

Get step-by-step solutions from verified subject matter experts