

Question: 2. For the following graph, state the following using the table below. [10] Even or odd degree 2- Least possible degree Leading coefficient (positive or
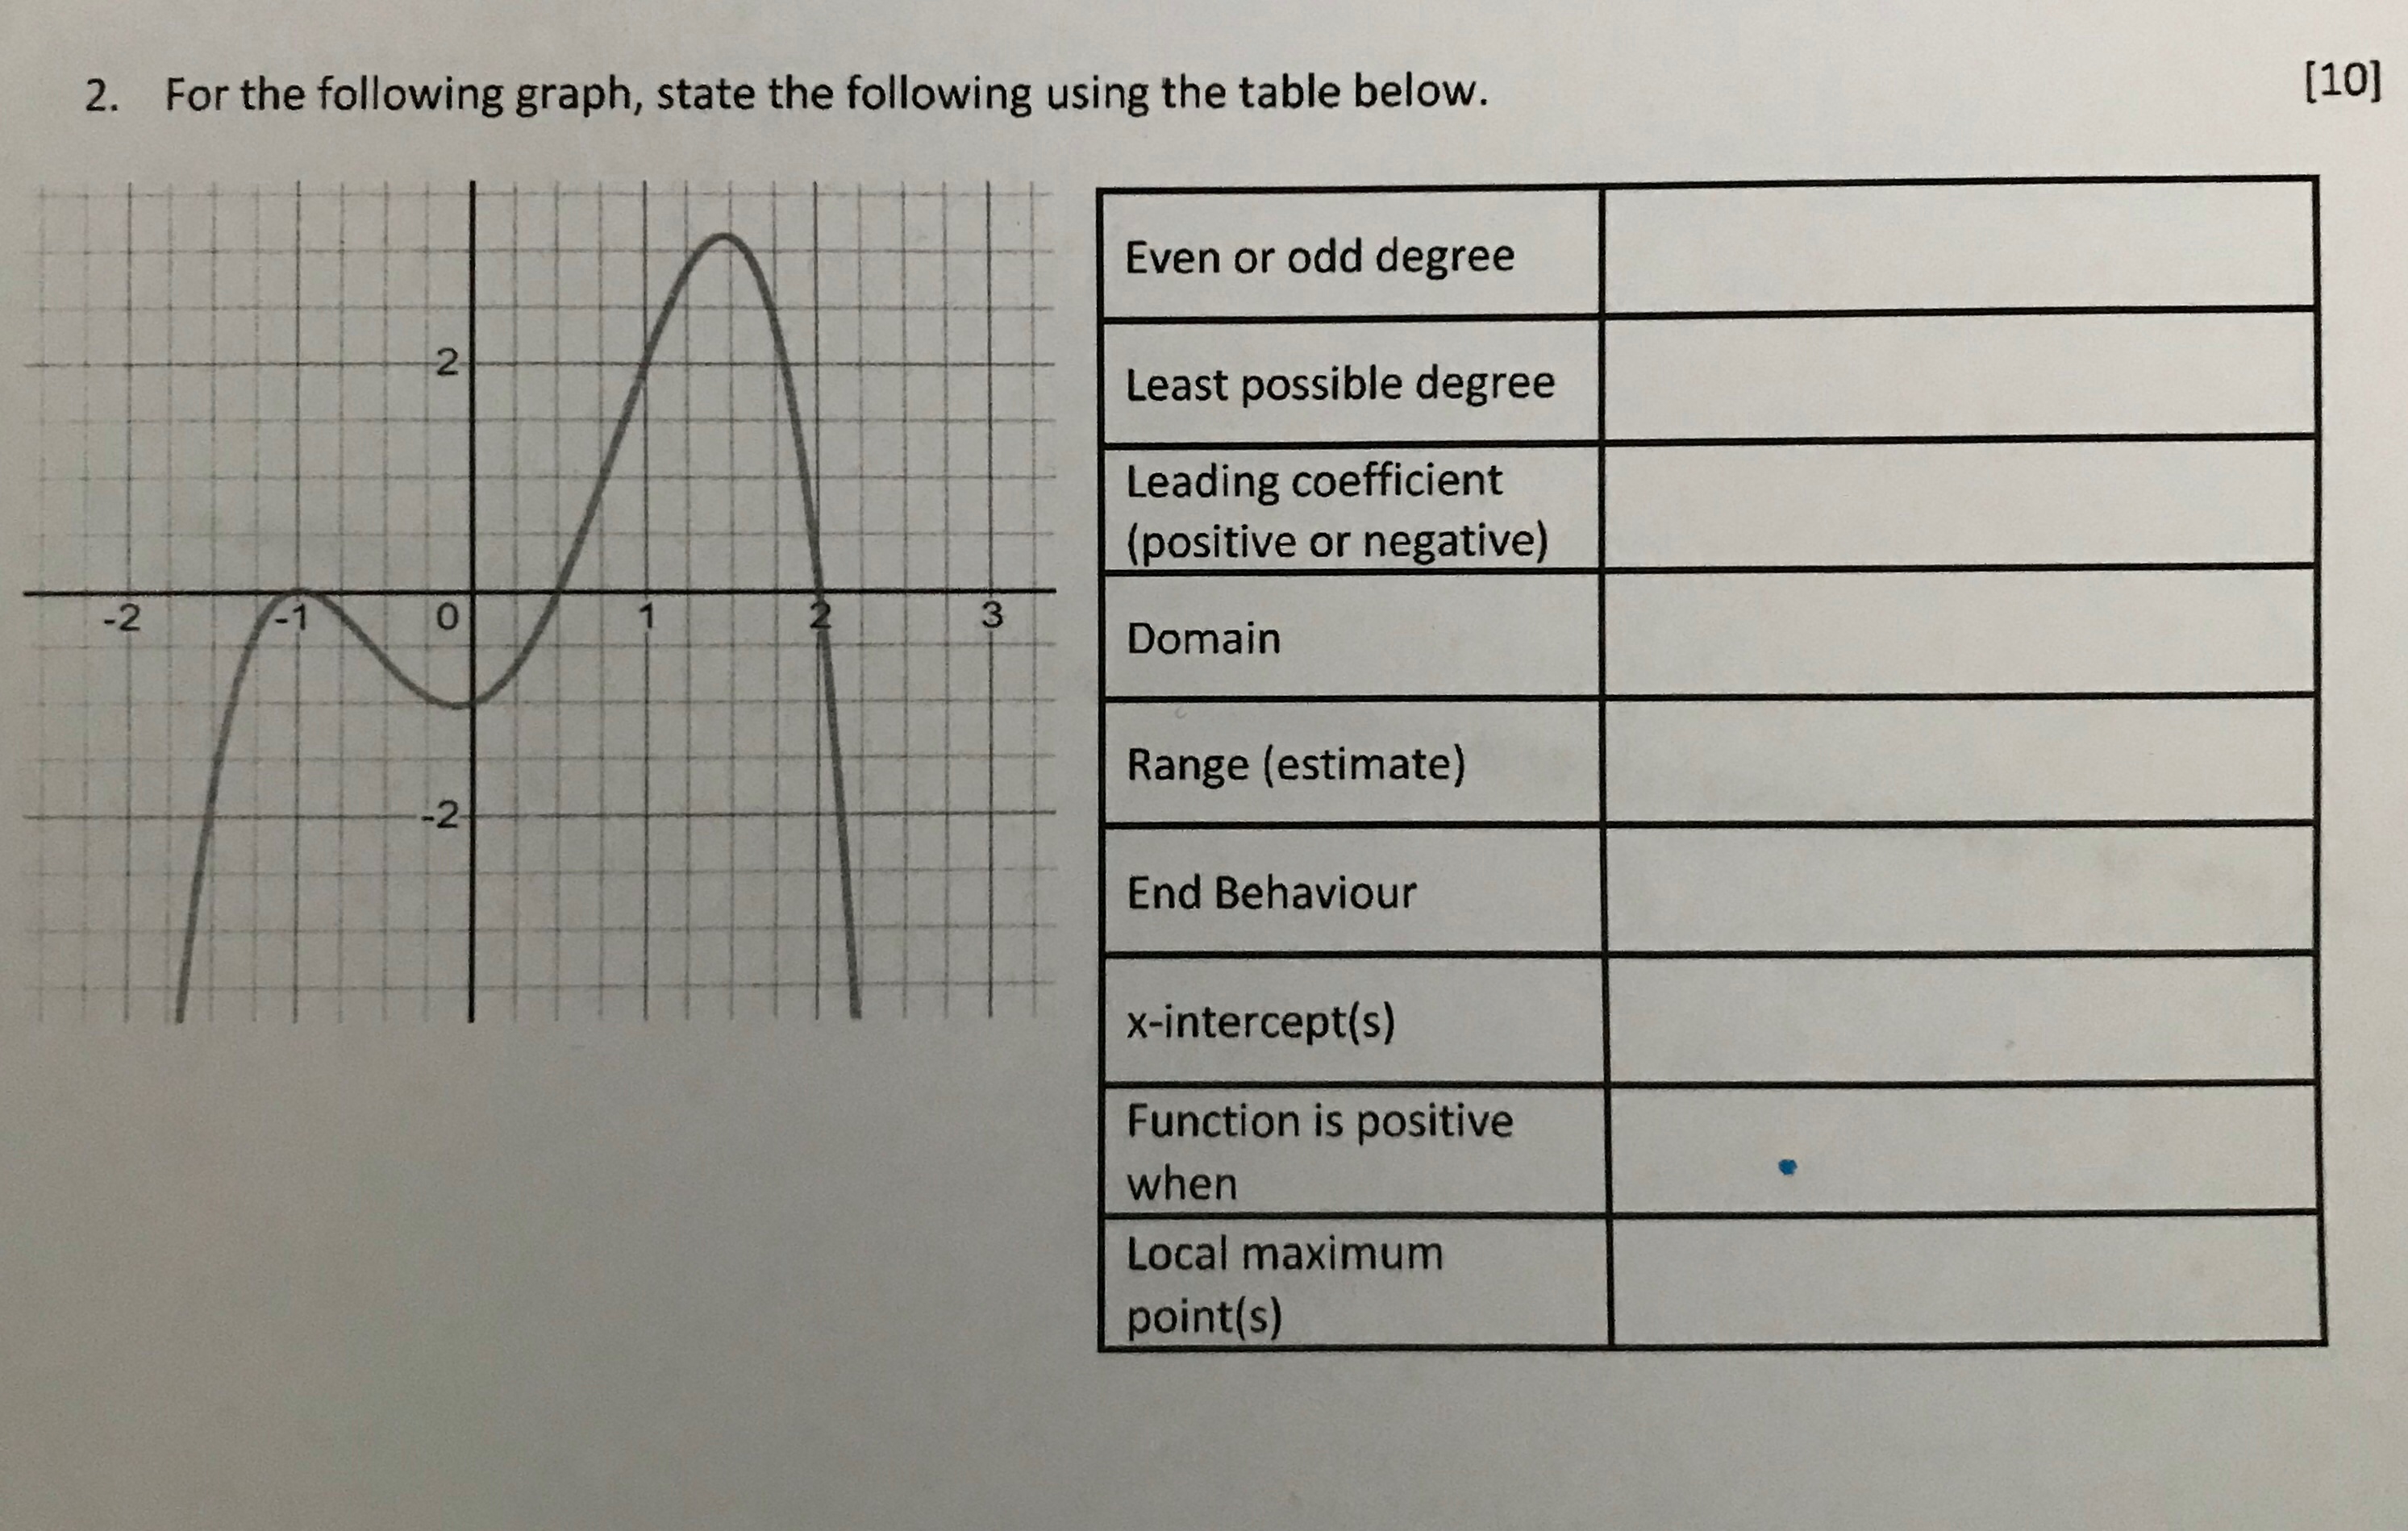
2. For the following graph, state the following using the table below. [10] Even or odd degree 2- Least possible degree Leading coefficient (positive or negative) -2 -1 0 Not 3 Domain Range (estimate) -2- End Behaviour x-intercept(s) Function is positive when Local maximum point(s)
Step by Step Solution
There are 3 Steps involved in it
1 Expert Approved Answer
Step: 1 Unlock

Question Has Been Solved by an Expert!
Get step-by-step solutions from verified subject matter experts
Step: 2 Unlock
Step: 3 Unlock