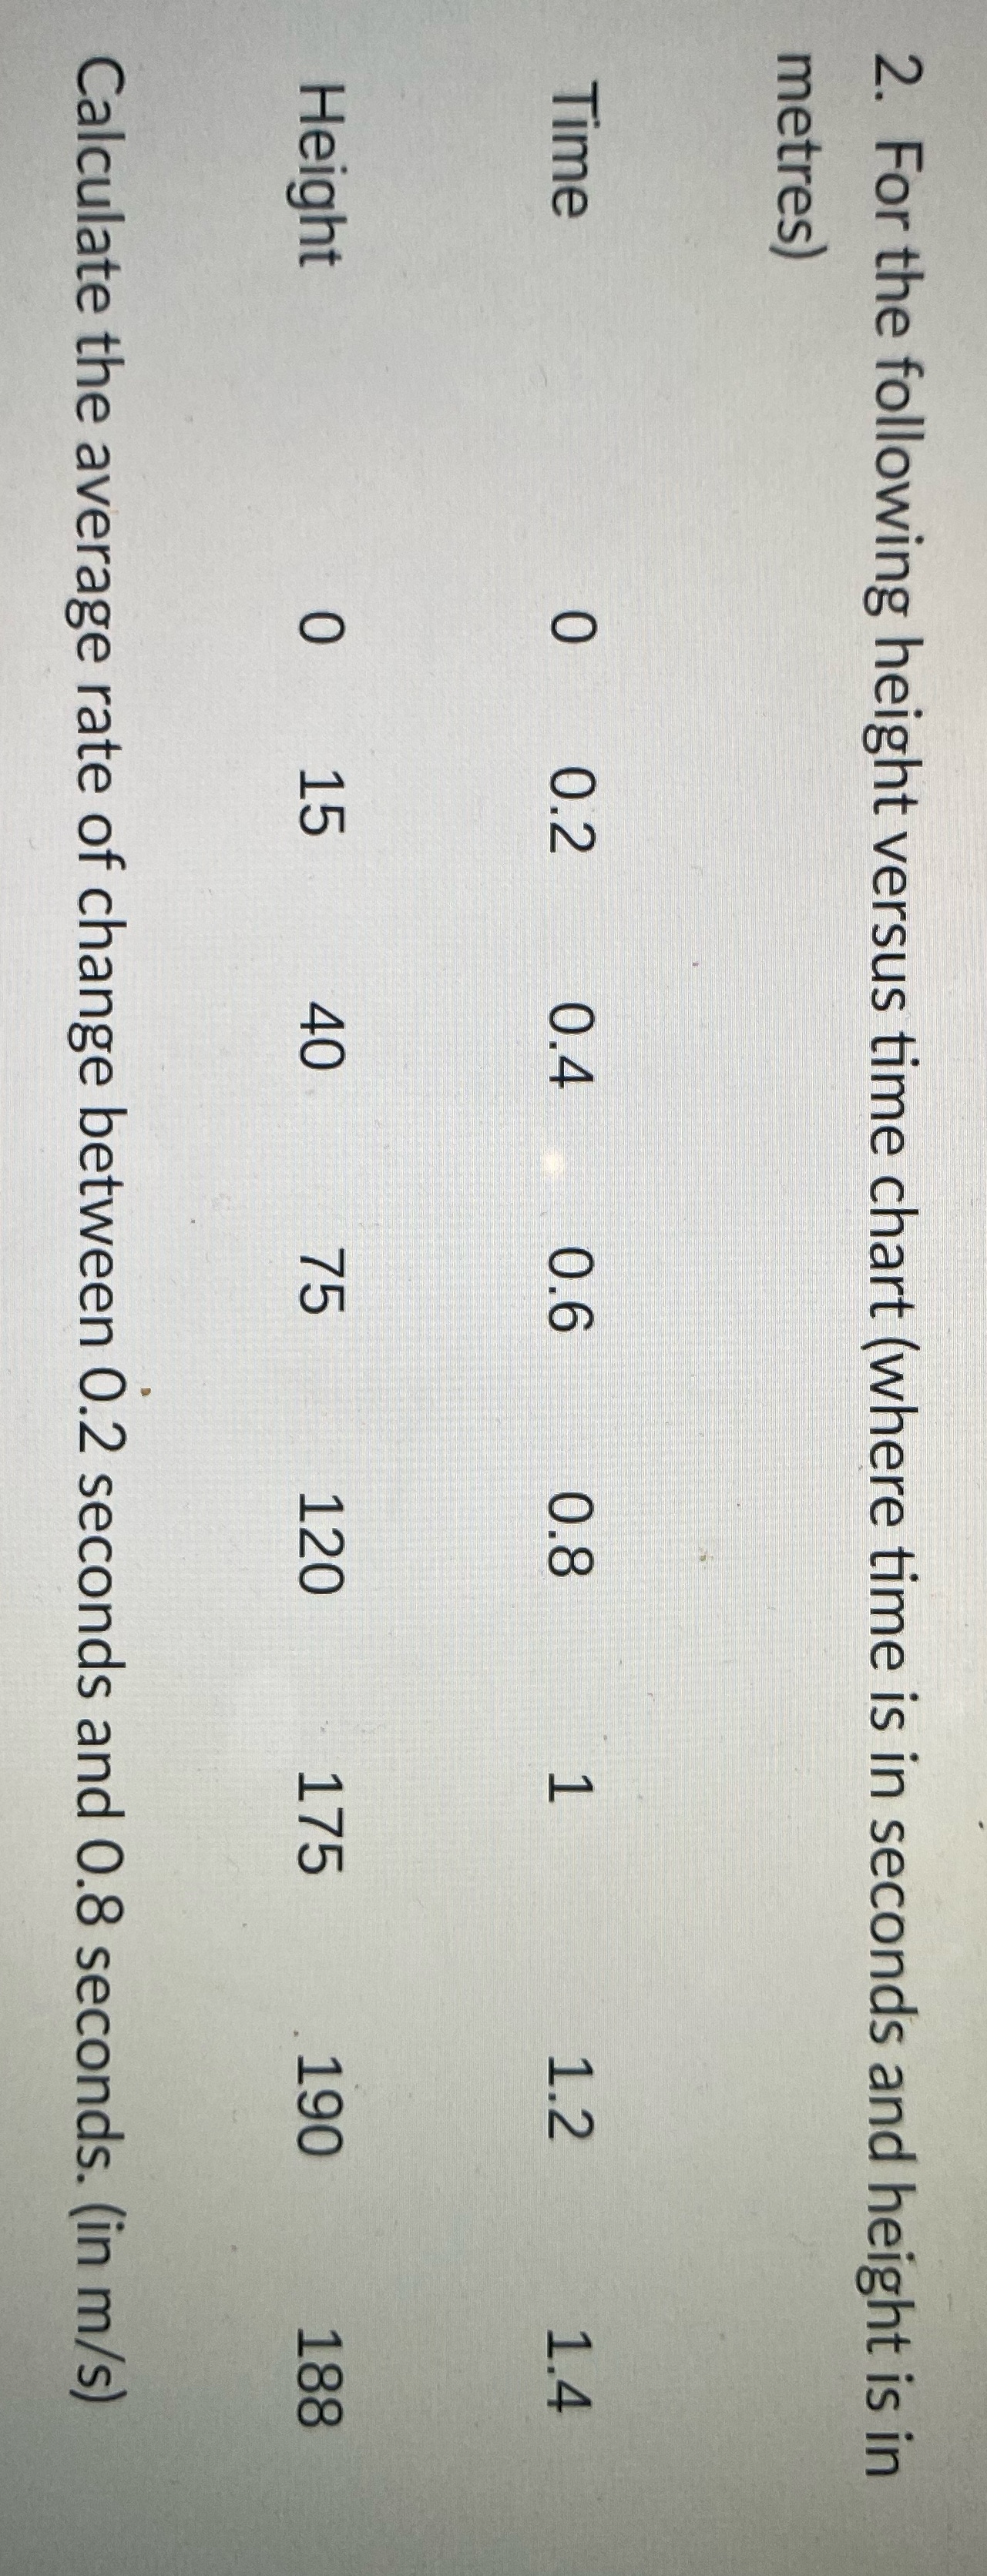
Question: 2. For the following height versus time chart (where time is in seconds and height is in metres) Time 0 0.2 0.4 0.6 0.8 H

2. For the following height versus time chart
2. For the following height versus time chart (where time is in seconds and height is in metres) Time 0 0.2 0.4 0.6 0.8 H 1.2 Height O 120 175 190 188 Calculate the average rate of change between 0.2 seconds and 0.8 seconds. (in m/s)

Step by Step Solution

There are 3 Steps involved in it

1 Expert Approved Answer
Step: 1 Unlock blur-text-image
Question Has Been Solved by an Expert!

Get step-by-step solutions from verified subject matter experts

Step: 2 Unlock
Step: 3 Unlock

Students Have Also Explored These Related Mathematics Questions!