

Question: 2) For the following problems, use Exhibit A. For exhibit A, the amount of sales depends on the production volume shown below. The dividend policy
![dividend policy is to pay [21+D+C]% in dividends. Construct the Production volume](https://s3.amazonaws.com/si.experts.images/answers/2024/07/6698bff5f0d66_6456698bff56a800.jpg)
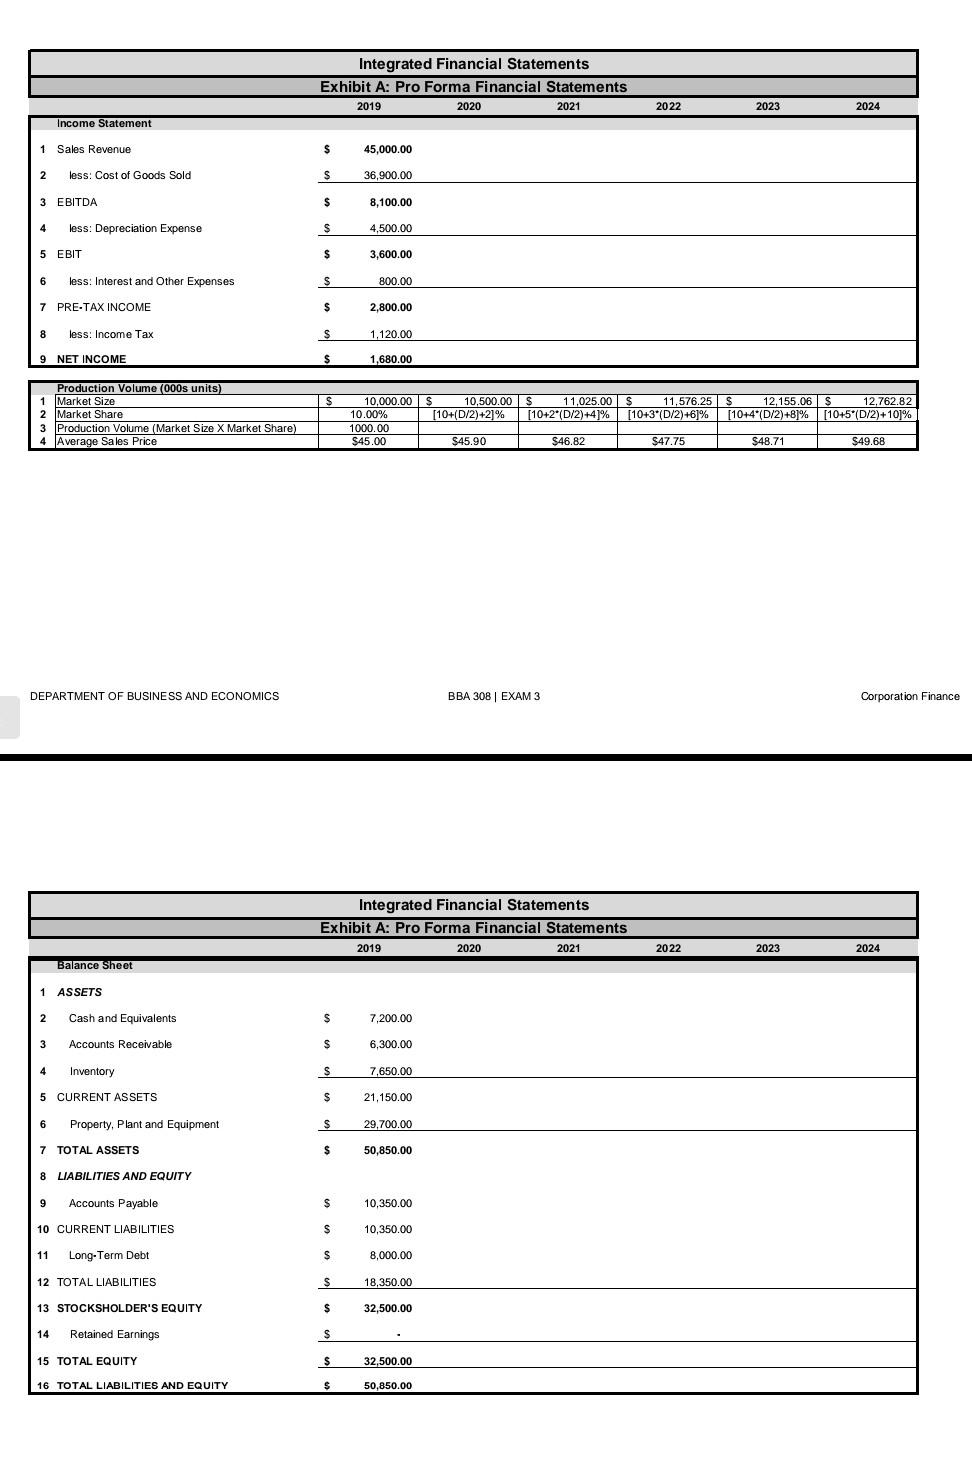
2) For the following problems, use Exhibit A. For exhibit A, the amount of sales depends on the production volume shown below. The dividend policy is to pay [21+D+C]% in dividends. Construct the Production volume table based on your student ID number as per the instructions shown below. a. What will be the depreciation for 2023? NOTE: Provide your answers in dollars. E.G. for 100M you must enter 100000000.0000, for 20M you must enter 20000000.000, etc. b. What will be the cash and equivalents for 2020? NOTE: Provide your answers in dollars. E.G. for 100M you must enter 100000000.0000, for 20M you must enter 20000000.000, etc. c. What will be the accounts payable for 2021? NOTE: Provide your answers in dollars. E.G. for 100M you must enter 100000000.0000, for 20M you must enter 20000000.000, etc. d. Imagine that the corporation decides to use debt for any external financing, what would be the amount of debt in 2020? (If no net new financing is needed, then answer with a negative number) NOTE: Provide your answers in dollars. E.G. for 100M you must enter 100000000.0000, for 20M you must enter 20000000.000, etc. Integrated Financial Statements Exhibit A: Pro Forma Financial Statements 2019 2020 2021 2022 2023 2024 Income Statement 1 1 Sales Revenue $ 45,000.00 2 less: Cost of Goods Sold : $ 36,900.00 3 EBITDA $ 8,100.00 4 less: Depreciation Expense $ 4,500.00 5 EBIT $ 3,600.00 6 less: Interest and Other Expenses $ 800.00 7 PRE-TAX INCOME 7 - $ 2,800.00 8 less: Income Tax : s $ 1,120.00 9 NET INCOME $ 1,680.00 $ Production Volume (000s units) 1 Market Size 2 Market Share 3 Production Volume (Market Size X Market Share) 4 Average Sales Price 10,000.00 $ 10,500.00 $ 11,025.00 $ 11,576.25 $ 12.155.06 S 12,762.82 10.00% [10+(D/2)+2% [10+2*(D/2)+41% [10+3*(D/2) +6]%[10+4*(D/2)+8]% 3*D [10+5*(D/2)+10% 1000.00 $45.00 $45.90 $46.82 $47.75 $48.71 $49.68 DEPARTMENT OF BUSINESS AND ECONOMICS BBA 308 | EXAM 3 Corporation Finance Integrated Financial Statements Exhibit A: Pro Forma Financial Statements 2019 2020 2021 2022 2023 2024 Balance Sheet 1 ASSETS 2 Cash and Equivalents $ 7,200.00 3 3 Accounts Receivable $ 6,300.00 4 4 Inventory $ 7,650.00 5 CURRENT ASSETS $ 21,150.00 6 Property, Plant and Equipment $ $ 29,700.00 $ 50,850.00 7 7 TOTAL ASSETS 8 LIABILITIES AND EQUITY 9 9 Accounts Payable $ 10,350.00 10 CURRENT LIABILITIES $ 10,350.00 11 Long-Term Debt $ 8,000.00 12 TOTAL LIABILITIES $ 18,350.00 13 STOCKSHOLDER'S EQUITY $ 32,500.00 14 Retained Earnings $ 15 TOTAL EQUITY $ 32.500.00 16 TOTAL LIABILITIES AND EQUITY $ 50,850.00 2021 Integrated Financial Statement Template Exhibit B: Free Cash Flow and Valuation 2019 2020 Income Statement 1 Sales Revenue $ 104,580.00 $ 143,224.40 S less: Cost of Goods Sold $ 73,206.00 $ 100,257.08 S 3 EBITDA s 31,374.00 $ 42,967.32 s 4 less: Depreciation Expense $ 15,687.00 $ 21,483.66 $ 5 EBIT $ 15,687.00 $ 21,483.66 $ 6 less: Interest and Other Expenses 405.00 $ 405.00 S 7 PRE-TAX INCOME 15,282.00 $ 21,078.66 $ less: Income Tax 6,876.90 9,485.40 S 9 NET INCOME 8,405.10 $ 11,593.265 187,455.11 131,218.58 56,236.53 28,118.27 28,118.27 4,230.00 23,888.27 10.749.72 13.138.55 35,557.20 $ 27,190.80 $ 24,053,40 S 86,801.40 $ 62.748.00 S 149,549.40 $ 48,696.30 $ 37,238.34 $ 32.941.61 S 118,876.25 S 85,934.64 $ 204,810.89 $ 63,734.74 48,738.33 43, 114.68 155,587.74 112,473.07 268,060.81 Balance Sheet 1 ASSETS 2 Cash and Equivalents 3 Accounts Receivable 4 Inventory 5 CURRENT ASSETS 6 Property, Plant and Equipment 7 TOTAL ASSETS 8 UABILITIES AND EQUITY Accounts Payable 10 CURRENT LIABILITIES 11 Long-Term Debt 12 TOTAL LIABILITIES 13 STOCKSHOLDER'S EQUITY 14 Retained Earnings 15 TOTAL EQUITY 16 TOTAL LIABILITIES AND EQUITY 18,824,40 S 18,824.40 $ 4,500.00 $ 23,324.40 126,225.00 $ S 126,225.00 149,549.40 S 25,780.39 $ 25,780.39 $ 47,000.00 $ 72,780.39 S 74,134.00 $ 8,115.28 $ 82,249.28 $ 155,029.68 $ 33,741.92 33,741.92 47,000.00 80.741.92 74,134.00 9,196.98 83,330.98 164,072.90 Net Working Capital Requirements Ourrent Assets 1 2 Current Liabilities 3 Net Working Capital 4 Increase in Net Working Capital Capital Investment 1 Capital Investment $ 2,500.00 45,000.00 7,500.00 Corporation Finance DEPARTMENT OF BUSINESS AND ECONOMICS BBA 308 | EXAM 3 Integrated Financial Statement Template Exhibit B: Free Cash Flow and Valuation 2019 2020 2021 Free Cash Flow (000s) 1 Net Income 2 Plus: After-Tax Interes Expense 3 Unlevered Net Income 4 Plus: Depreciation 5 Less: Increases in NWC 6 Less: Capital Expenditures 7 Free Cash Flow of Firm Valuation of the Growth Free Cash Flow of the Firm 2 PV of the Cash Flow 3 Continuation Value PV of Continuation Value 5 net Interest Expense 6 Interest Tax Shield 7 PV Interest Tax Shield 8 Firm Value
Step by Step Solution
There are 3 Steps involved in it

Get step-by-step solutions from verified subject matter experts