

Question: 2. For the set of data, compare two models and determine which one best fits the data (where x = years after 1900) U.S.
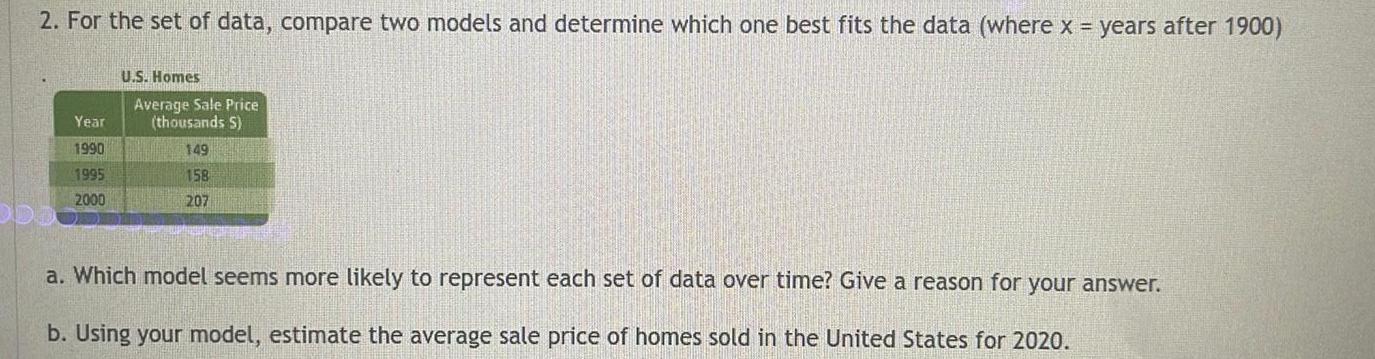
2. For the set of data, compare two models and determine which one best fits the data (where x = years after 1900) U.S. Homes Average Sale Price (thousands S) 149 Year 1990 1995 2000 158 207 a. Which model seems more likely to represent each set of data over time? Give a reason for your answer. b. Using your model, estimate the average sale price of homes sold in the United States for 2020.
Step by Step Solution
There are 3 Steps involved in it
1 Expert Approved Answer
Step: 1 Unlock

Question Has Been Solved by an Expert!
Get step-by-step solutions from verified subject matter experts
Step: 2 Unlock
Step: 3 Unlock