

Question: 2. Form the yield curve graph enter the data to the following table Rate 1 month 3 month 6 month 1 year 2 year 3
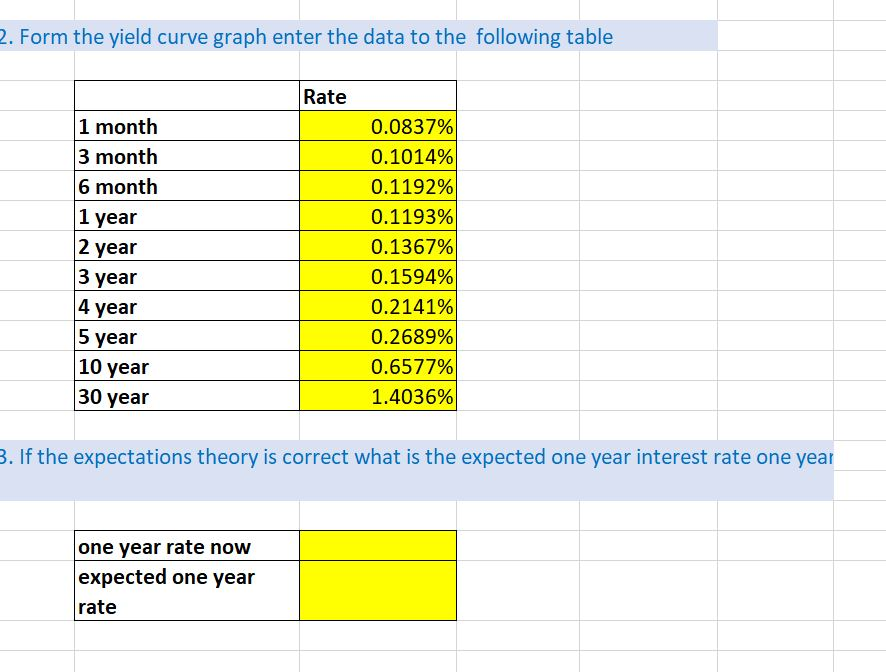
2. Form the yield curve graph enter the data to the following table Rate 1 month 3 month 6 month 1 year 2 year 3 year 4 year 5 year 10 year 30 year 0.0837% 0.1014% 0.1192% 0.1193% 0.1367% 0.1594% 0.2141% 0.2689% 0.6577% 1.4036% 3. If the expectations theory is correct what is the expected one year interest rate one year one year rate now expected one year rate
Step by Step Solution
There are 3 Steps involved in it
1 Expert Approved Answer
Step: 1 Unlock

Question Has Been Solved by an Expert!
Get step-by-step solutions from verified subject matter experts
Step: 2 Unlock
Step: 3 Unlock