

Question: 2. Frequency and Relative Frequency Distributions 5. Based on your discussion on the previous page, fill out this frequency / relative frequency distribution for the
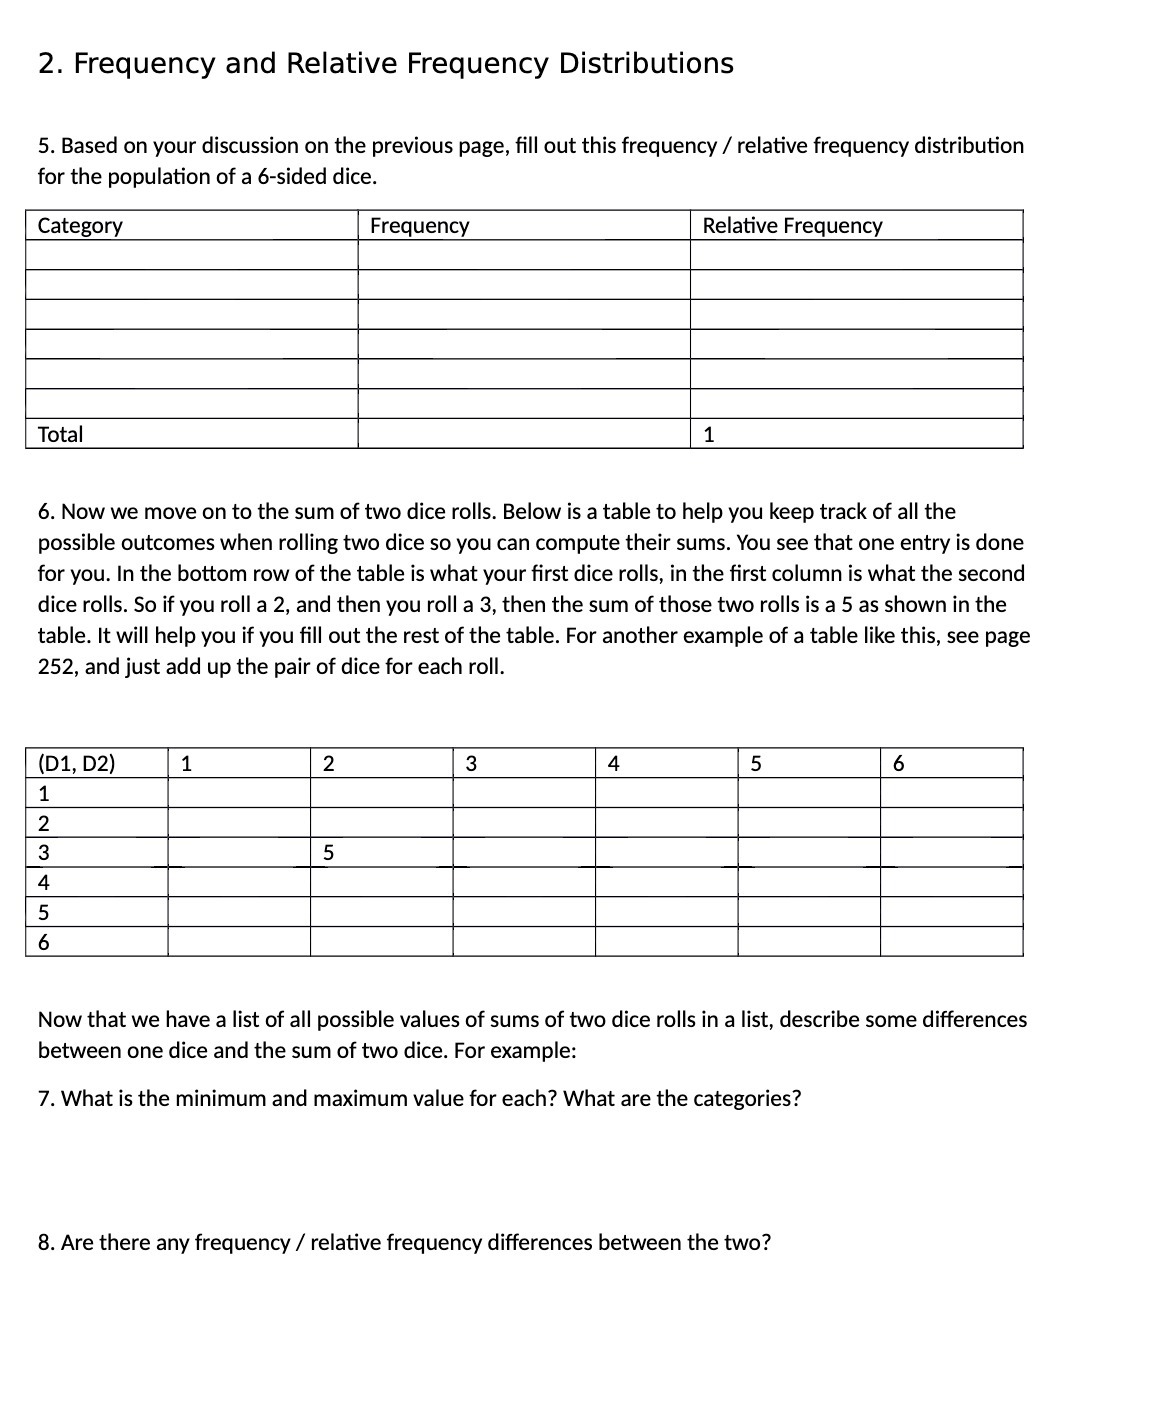
2. Frequency and Relative Frequency Distributions 5. Based on your discussion on the previous page, fill out this frequency / relative frequency distribution for the population of a 6-sided dice. Category Relative Frequency 6. Now we move on to the sum of two dice rolls. Below is a table to help you keep track of all the possible outcomes when rolling two dice so you can compute their sums. You see that one entry is done for you. In the bottom row of the table is what your first dice rolls, in the rst column is what the second dice rolls. So if you roll a 2, and then you roll a 3, then the sum of those two rolls is a 5 as shown in the table. It will help you if you fill out the rest of the table. For another example of a table like this, see page 252, and just add up the pair of dice for each roll. (01, I32) __ 1 2 5 6 Now that we have a list of all possible values of sums of two dice rolls in a list, describe some differences between one dice and the sum of two dice. For example: 7. What is the minimum and maximum value for each? What are the categories? 8. Are there any frequency / relative frequency differences between the two
Step by Step Solution
There are 3 Steps involved in it

Get step-by-step solutions from verified subject matter experts