

Question: 2. From the assignment 4 balance sheet numbers calculate the Current Ratio based on averages from the Beginning and Ending Balance sheet. Would you consider
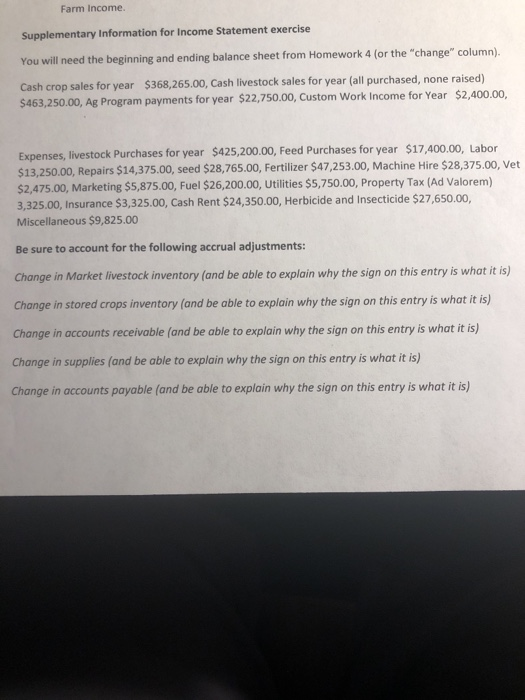
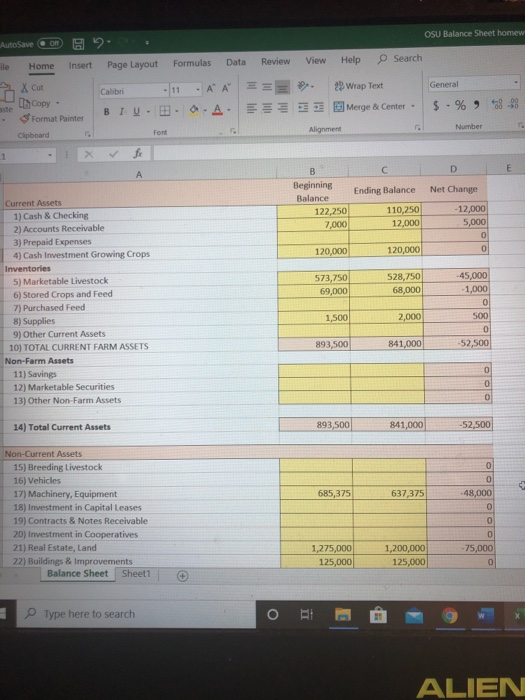
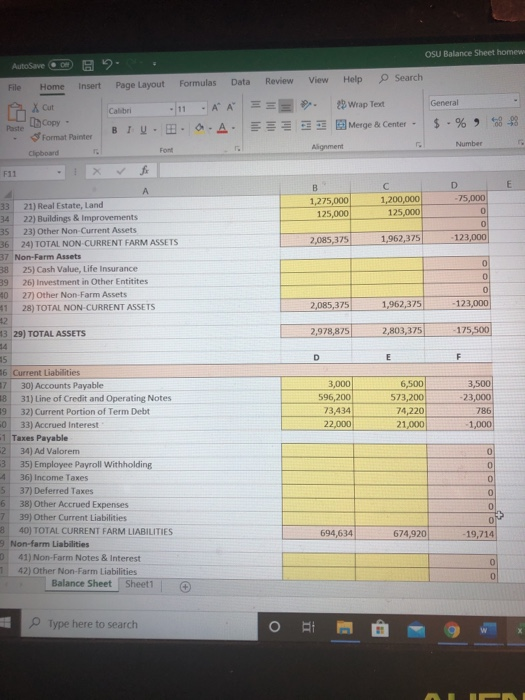
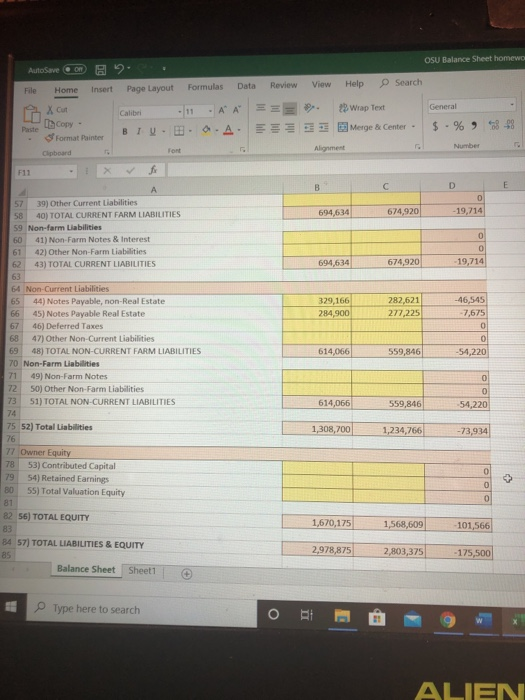
2. From the assignment 4 balance sheet numbers calculate the Current Ratio based on averages from the Beginning and Ending Balance sheet. Would you consider this number (very strong, strong, weak, or critically weak). Explain. 3. Use the following information (along with the balance sheet information from assignment 4) to fill in the blank OSU income statement excel template (also on the website) and calculate Net Farm Income. oplementary Information for Income Statement exercise will need the beginning and ending balance sheet from Homework 4 (or the "change" column). th crop sales for year $368,265.00, Cash livestock sales for year (all purchased, none raised) 3,250.00, Ag Program payments for year $22,750.00, Custom Work Income for Year $2,400.00, Farm Income. Supplementary Information for Income Statement exercise You will need the beginning and ending balance sheet from Homework 4 (or the "change column). Cash crop sales for year $368,265.00, Cash livestock sales for year (all purchased, none raised) $463,250.00, Ag Program payments for year $22,750.00, Custom Work Income for Year $2,400.00, Expenses, livestock Purchases for year $425,200.00, Feed Purchases for year $17,400.00, Labor $13,250.00, Repairs $14,375.00, seed $28,765.00, Fertilizer $47,253.00, Machine Hire $28,375.00, Vet $2,475.00, Marketing $5,875.00, Fuel $26,200.00, Utilities $5,750.00, Property Tax (Ad Valorem) 3,325.00, Insurance $3,325.00, Cash Rent $24,350.00, Herbicide and Insecticide $27,650.00, Miscellaneous $9,825.00 Be sure to account for the following accrual adjustments: Change in Market livestock inventory (and be able to explain why the sign on this entry is what it is) Change in stored crops inventory (and be able to explain why the sign on this entry is what it is) Change in accounts receivable and be able to explain why the sign on this entry is what it is) Change in supplies (and be able to explain why the sign on this entry is what it is) Change in accounts payable (and be able to explain why the sign on this entry is what it is) Change in accrued interest (and be able to explain why the sign on this entry is what it it) Management Depreciation for the accounting period is $66,350.00 The farm paid $64,178.00 in farm interest during the year. The farm sold a tractor and some equipment for $8,250.00 more than the management book value at the time of sale. Ignore the "non-farm" section of the income statement Fill in the Blank Example Income Statement and calculate net farm income Assume the farm needs to draw $20,000 from this farm in unpaid family labor. Calculate Return on Assets (based on average assets for the year) for this farm using the FFSG guidelines. Would you consider your calculated measure satisfactory? OSU Balance Sheet homew AutoSave le Home y Xcut Insert Review View : Page Layout Formulas Data Calibri - 11 -AA BIU - A.A. Help Search 25 Wrap Text Merge & Center General Copy - Format Painter Clipboard $ -% 788 Numbers Alignment 1 - 1 X fr Ending Balance Beginning Balance 122,250 7,000 110,250 12,000 Net Change 12.000 5,000 120,000 120,000 0 573,750 69,000 528,750 68,000 Current Assets 1) Cash & Checking 2) Accounts Receivable 3) Prepaid Expenses 4) Cash Investment Growing Crops Inventories 5) Marketable Livestock 6) Stored Crops and Feed 7) Purchased Feed 8) Supplies 9) Other Current Assets 10) TOTAL CURRENT FARM ASSETS Non-Farm Assets 11) Savings 12) Marketable Securities 13) Other Non-Farm Assets 45,000 1.000 0 1,500 2,000 500 0 52,500 893,500 8 41,000 14) Total Current Assets 893 500 841.000 52.500 685,375 637 375 -48.000 Non-Current Assets 15) Breeding Livestock 16) Vehicles 17) Machinery, Equipment 18) Investment in Capital Leases 19) Contracts & Notes Receivable 20) Investment in Cooperatives 21) Real Estate, Land 22) Buildings & Improvements Balance Sheet Sheet1 1,275,000 125,000 1,200,000 125,000 75,000 0 Type here to search ALIEN AutoSavem 2 le Home Insert Page Layout Calibri - Format Painter BTU - Font o xan Paste Copy - General OSU Balance Sheet homew Help Search Wrap Text Merge & Center - $ . % *78-8 View . E Formulas Data Review 11 AA == E 0.A. S E Alignment Number -75,000 1,275,000 125,000 1,200,000 125,000 2,085,375 1,962,375 123,000 33 21) Real Estate, Land 34 22) Buildings & Improvements 35 23) Other Non-Current Assets 36 24) TOTAL NON-CURRENT FARM ASSETS 37 Non-Farm Assets 38 25) Cash Value, Life Insurance 39 26) Investment in Other Entitites 40 27) Other Non-Farm Assets 41 28) TOTAL NON-CURRENT ASSETS 2,085,375 1.962,375 - 123.000 1329) TOTAL ASSETS 2,978,875 2,803,375 175,500 3,500 23,000 3,000 596,200 73,434 22,000 6,500 573,200 74,220 21,000 786 1,000 36 Current Liabilities 37 30) Accounts Payable 18 31) Line of Credit and Operating Notes 19 32) Current Portion of Term Debt 0 33) Accrued interest -1 Taxes Payable 2 34) Ad Valorem 3 35) Employee Payroll Withholding 4 36) Income Taxes 5 37) Deferred Taxes 6 38) Other Accrued Expenses 7 39) Other Current Liabilities 8 40) TOTAL CURRENT FARM LIABILITIES 9 Non-farm Liabilities 0 41) Non-Farm Notes & Interest 1 42) Other Non-Farm Liabilities Balance Sheet Sheet1 694,634 674,920 -19,714 Type here to search OSU Balance Sheet homewo AutoSaveo O Home Data View Review Help Insert Search tur Page Layout Formulas Calibri -11 AA BI 3. A.A Font SEE E Wrap Text Merge Center - General $ - % *58-68 - Format Printer Alignment D 694.634 674,920 - 19,714 5739) Other Current Liabilities 58 40) TOTAL CURRENT FARM LIABILITIES 59 Non-farm Liabilities 60 41) Non-Farm Notes & Interest 61 42) Other Non-Farm Liabilities 62 43) TOTAL CURRENT LIABILITIES O 694,634 674,920 19,714 329,166 284 900 2 82,621 277,225 -46,545 7,675 0 64 Non-Current Liabilities 65 44) Notes Payable, non-Real Estate 66 45) Notes Payable Real Estate 67 46) Deferred Taxes 68 47) Other Non-Current Liabilities 69 48) TOTAL NON-CURRENT FARM LIABILITIES 70 Non-Farm Liabilities 71 49) Non-Farm Notes 72 50) Other Non-Farm Liabilities 73 51) TOTAL NON-CURRENT LIABILITIES 614,066 559,846 -54,220 614,066 559,846 54,220 1,308,700 1,234,766 -73,934 75 52) Total Liabilities 76 77 Owner Equity 78 53) Contributed Capital 79 54) Retained Earnings 80 55) Total Valuation Equity 81 82 56) TOTAL EQUITY 1,670,175 1.568.609 101,566 83 84 57) TOTAL LIABILITIES & EQUITY 2,978,875 2,803,375 - 175,500 Balance Sheet Sheet1 Type here to search ALIEN 2. From the assignment 4 balance sheet numbers calculate the Current Ratio based on averages from the Beginning and Ending Balance sheet. Would you consider this number (very strong, strong, weak, or critically weak). Explain. 3. Use the following information (along with the balance sheet information from assignment 4) to fill in the blank OSU income statement excel template (also on the website) and calculate Net Farm Income. oplementary Information for Income Statement exercise will need the beginning and ending balance sheet from Homework 4 (or the "change" column). th crop sales for year $368,265.00, Cash livestock sales for year (all purchased, none raised) 3,250.00, Ag Program payments for year $22,750.00, Custom Work Income for Year $2,400.00, Farm Income. Supplementary Information for Income Statement exercise You will need the beginning and ending balance sheet from Homework 4 (or the "change column). Cash crop sales for year $368,265.00, Cash livestock sales for year (all purchased, none raised) $463,250.00, Ag Program payments for year $22,750.00, Custom Work Income for Year $2,400.00, Expenses, livestock Purchases for year $425,200.00, Feed Purchases for year $17,400.00, Labor $13,250.00, Repairs $14,375.00, seed $28,765.00, Fertilizer $47,253.00, Machine Hire $28,375.00, Vet $2,475.00, Marketing $5,875.00, Fuel $26,200.00, Utilities $5,750.00, Property Tax (Ad Valorem) 3,325.00, Insurance $3,325.00, Cash Rent $24,350.00, Herbicide and Insecticide $27,650.00, Miscellaneous $9,825.00 Be sure to account for the following accrual adjustments: Change in Market livestock inventory (and be able to explain why the sign on this entry is what it is) Change in stored crops inventory (and be able to explain why the sign on this entry is what it is) Change in accounts receivable and be able to explain why the sign on this entry is what it is) Change in supplies (and be able to explain why the sign on this entry is what it is) Change in accounts payable (and be able to explain why the sign on this entry is what it is) Change in accrued interest (and be able to explain why the sign on this entry is what it it) Management Depreciation for the accounting period is $66,350.00 The farm paid $64,178.00 in farm interest during the year. The farm sold a tractor and some equipment for $8,250.00 more than the management book value at the time of sale. Ignore the "non-farm" section of the income statement Fill in the Blank Example Income Statement and calculate net farm income Assume the farm needs to draw $20,000 from this farm in unpaid family labor. Calculate Return on Assets (based on average assets for the year) for this farm using the FFSG guidelines. Would you consider your calculated measure satisfactory? OSU Balance Sheet homew AutoSave le Home y Xcut Insert Review View : Page Layout Formulas Data Calibri - 11 -AA BIU - A.A. Help Search 25 Wrap Text Merge & Center General Copy - Format Painter Clipboard $ -% 788 Numbers Alignment 1 - 1 X fr Ending Balance Beginning Balance 122,250 7,000 110,250 12,000 Net Change 12.000 5,000 120,000 120,000 0 573,750 69,000 528,750 68,000 Current Assets 1) Cash & Checking 2) Accounts Receivable 3) Prepaid Expenses 4) Cash Investment Growing Crops Inventories 5) Marketable Livestock 6) Stored Crops and Feed 7) Purchased Feed 8) Supplies 9) Other Current Assets 10) TOTAL CURRENT FARM ASSETS Non-Farm Assets 11) Savings 12) Marketable Securities 13) Other Non-Farm Assets 45,000 1.000 0 1,500 2,000 500 0 52,500 893,500 8 41,000 14) Total Current Assets 893 500 841.000 52.500 685,375 637 375 -48.000 Non-Current Assets 15) Breeding Livestock 16) Vehicles 17) Machinery, Equipment 18) Investment in Capital Leases 19) Contracts & Notes Receivable 20) Investment in Cooperatives 21) Real Estate, Land 22) Buildings & Improvements Balance Sheet Sheet1 1,275,000 125,000 1,200,000 125,000 75,000 0 Type here to search ALIEN AutoSavem 2 le Home Insert Page Layout Calibri - Format Painter BTU - Font o xan Paste Copy - General OSU Balance Sheet homew Help Search Wrap Text Merge & Center - $ . % *78-8 View . E Formulas Data Review 11 AA == E 0.A. S E Alignment Number -75,000 1,275,000 125,000 1,200,000 125,000 2,085,375 1,962,375 123,000 33 21) Real Estate, Land 34 22) Buildings & Improvements 35 23) Other Non-Current Assets 36 24) TOTAL NON-CURRENT FARM ASSETS 37 Non-Farm Assets 38 25) Cash Value, Life Insurance 39 26) Investment in Other Entitites 40 27) Other Non-Farm Assets 41 28) TOTAL NON-CURRENT ASSETS 2,085,375 1.962,375 - 123.000 1329) TOTAL ASSETS 2,978,875 2,803,375 175,500 3,500 23,000 3,000 596,200 73,434 22,000 6,500 573,200 74,220 21,000 786 1,000 36 Current Liabilities 37 30) Accounts Payable 18 31) Line of Credit and Operating Notes 19 32) Current Portion of Term Debt 0 33) Accrued interest -1 Taxes Payable 2 34) Ad Valorem 3 35) Employee Payroll Withholding 4 36) Income Taxes 5 37) Deferred Taxes 6 38) Other Accrued Expenses 7 39) Other Current Liabilities 8 40) TOTAL CURRENT FARM LIABILITIES 9 Non-farm Liabilities 0 41) Non-Farm Notes & Interest 1 42) Other Non-Farm Liabilities Balance Sheet Sheet1 694,634 674,920 -19,714 Type here to search OSU Balance Sheet homewo AutoSaveo O Home Data View Review Help Insert Search tur Page Layout Formulas Calibri -11 AA BI 3. A.A Font SEE E Wrap Text Merge Center - General $ - % *58-68 - Format Printer Alignment D 694.634 674,920 - 19,714 5739) Other Current Liabilities 58 40) TOTAL CURRENT FARM LIABILITIES 59 Non-farm Liabilities 60 41) Non-Farm Notes & Interest 61 42) Other Non-Farm Liabilities 62 43) TOTAL CURRENT LIABILITIES O 694,634 674,920 19,714 329,166 284 900 2 82,621 277,225 -46,545 7,675 0 64 Non-Current Liabilities 65 44) Notes Payable, non-Real Estate 66 45) Notes Payable Real Estate 67 46) Deferred Taxes 68 47) Other Non-Current Liabilities 69 48) TOTAL NON-CURRENT FARM LIABILITIES 70 Non-Farm Liabilities 71 49) Non-Farm Notes 72 50) Other Non-Farm Liabilities 73 51) TOTAL NON-CURRENT LIABILITIES 614,066 559,846 -54,220 614,066 559,846 54,220 1,308,700 1,234,766 -73,934 75 52) Total Liabilities 76 77 Owner Equity 78 53) Contributed Capital 79 54) Retained Earnings 80 55) Total Valuation Equity 81 82 56) TOTAL EQUITY 1,670,175 1.568.609 101,566 83 84 57) TOTAL LIABILITIES & EQUITY 2,978,875 2,803,375 - 175,500 Balance Sheet Sheet1 Type here to search ALIEN
Step by Step Solution
There are 3 Steps involved in it

Get step-by-step solutions from verified subject matter experts